


One look at this has me spooked…
Chart
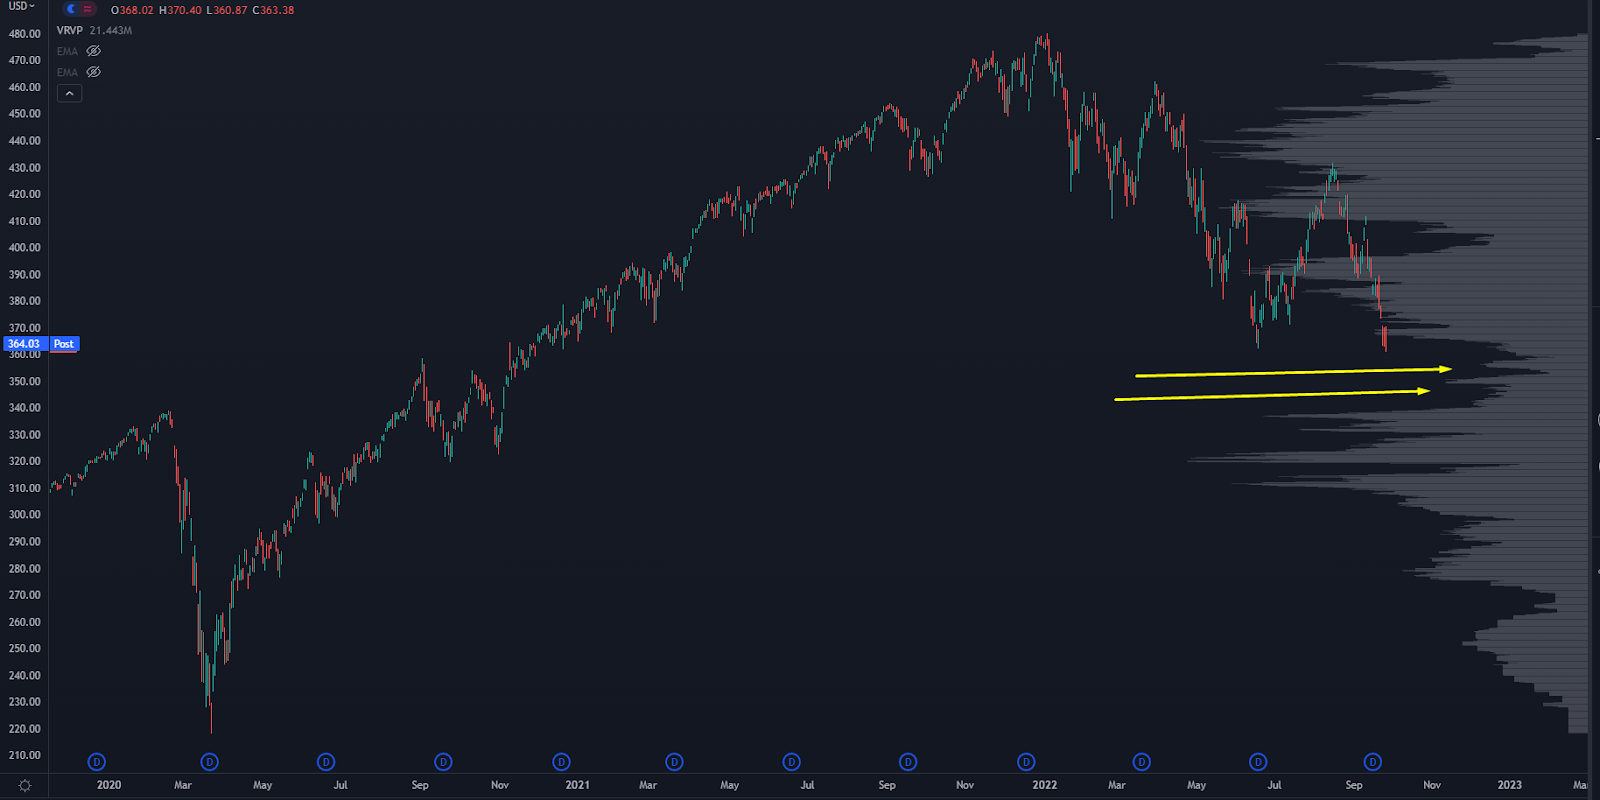
See that giant “void” in the volume levels of the chart?
You can think of it like “quicksand” in the markets… it’s a liquidity pocket where very little volume has traded.
And it could serve as a major sink-hole to markets as we move through the fall.
Over the past 2 years, the market has built out trade liquidity at all sorts of prices… but just underneath lies a “liquidity pocket”.
If you bought a stock at 100 and sold at 150, you’d probably get interested again if it pulls a Jen Psaki and “circles back” to 100 again.
But if there aren’t enough prior buyers to “anchor” into a level, then you can get a swift “woosh” through that range.
Here’s a recent example in the SPY:
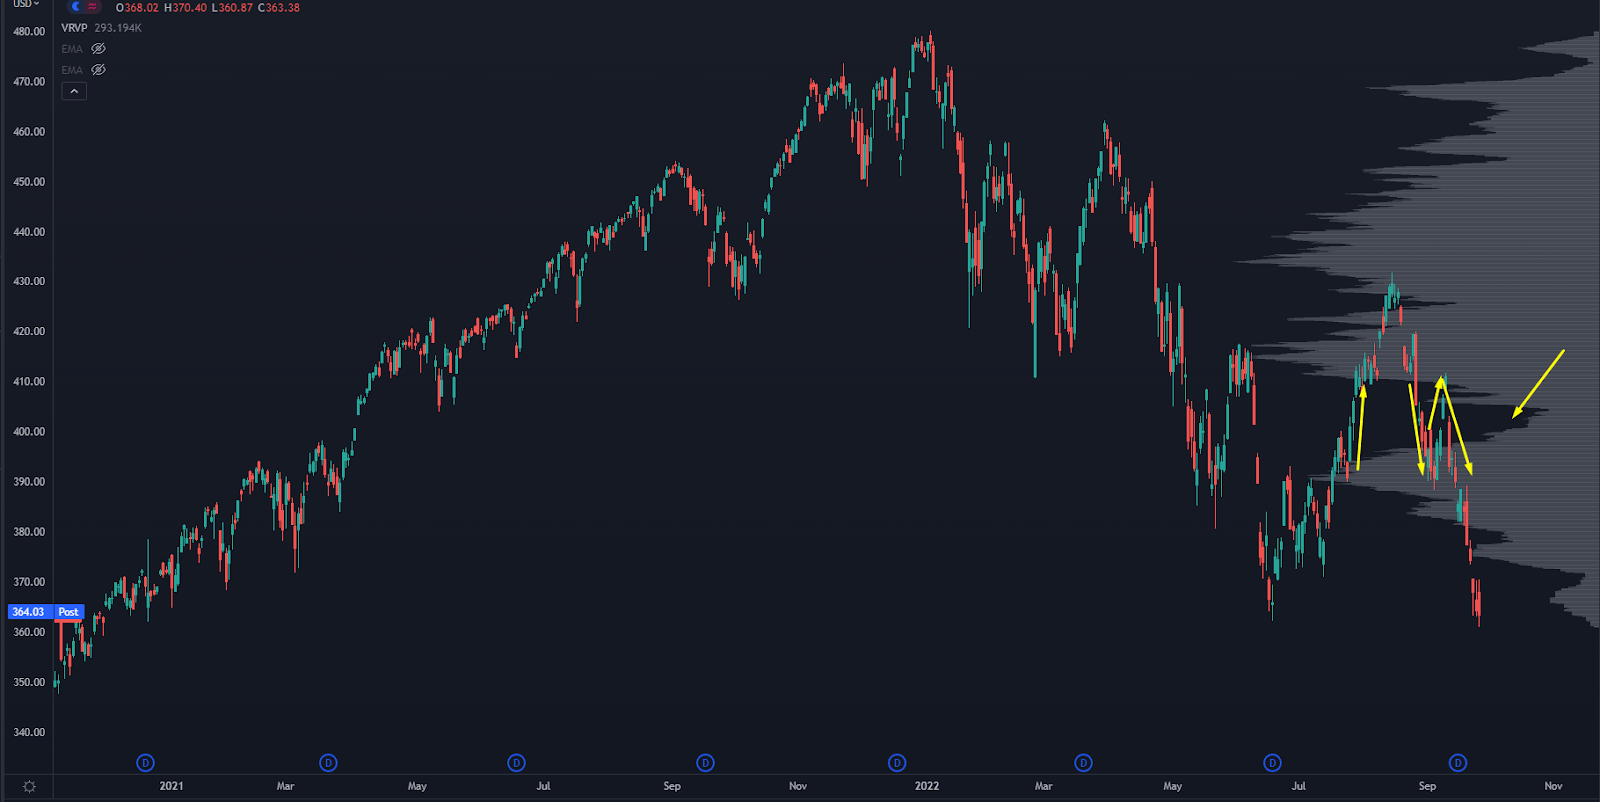
SPY Chart
Here’s a recent example in the SPY:

SPY Chart
See that liquidity pocket from higher prices?
Any time we moved into that area, we just blasted through it…
Both to the upside and the downside.
Markets are looking spooky into October. Either we start to hold these levels, or be ready for another push.
And to put this in context… another 3-6% lower would get us through that level, which is “normal” price action in a bear market.
And if that does happen, we’ve got some monster “lodestone levels” on quality names.
So what is a Lodestone Level? And how should you trade it?
>>> Check Out Our Free Live Training Here
Original Post Can be Found Here