One thing traders can do during nasty bear markets is look for stocks showing relative strength.
You can measure relative strength in many ways, but the easiest way is to just look at the recent pivot highs and lows.
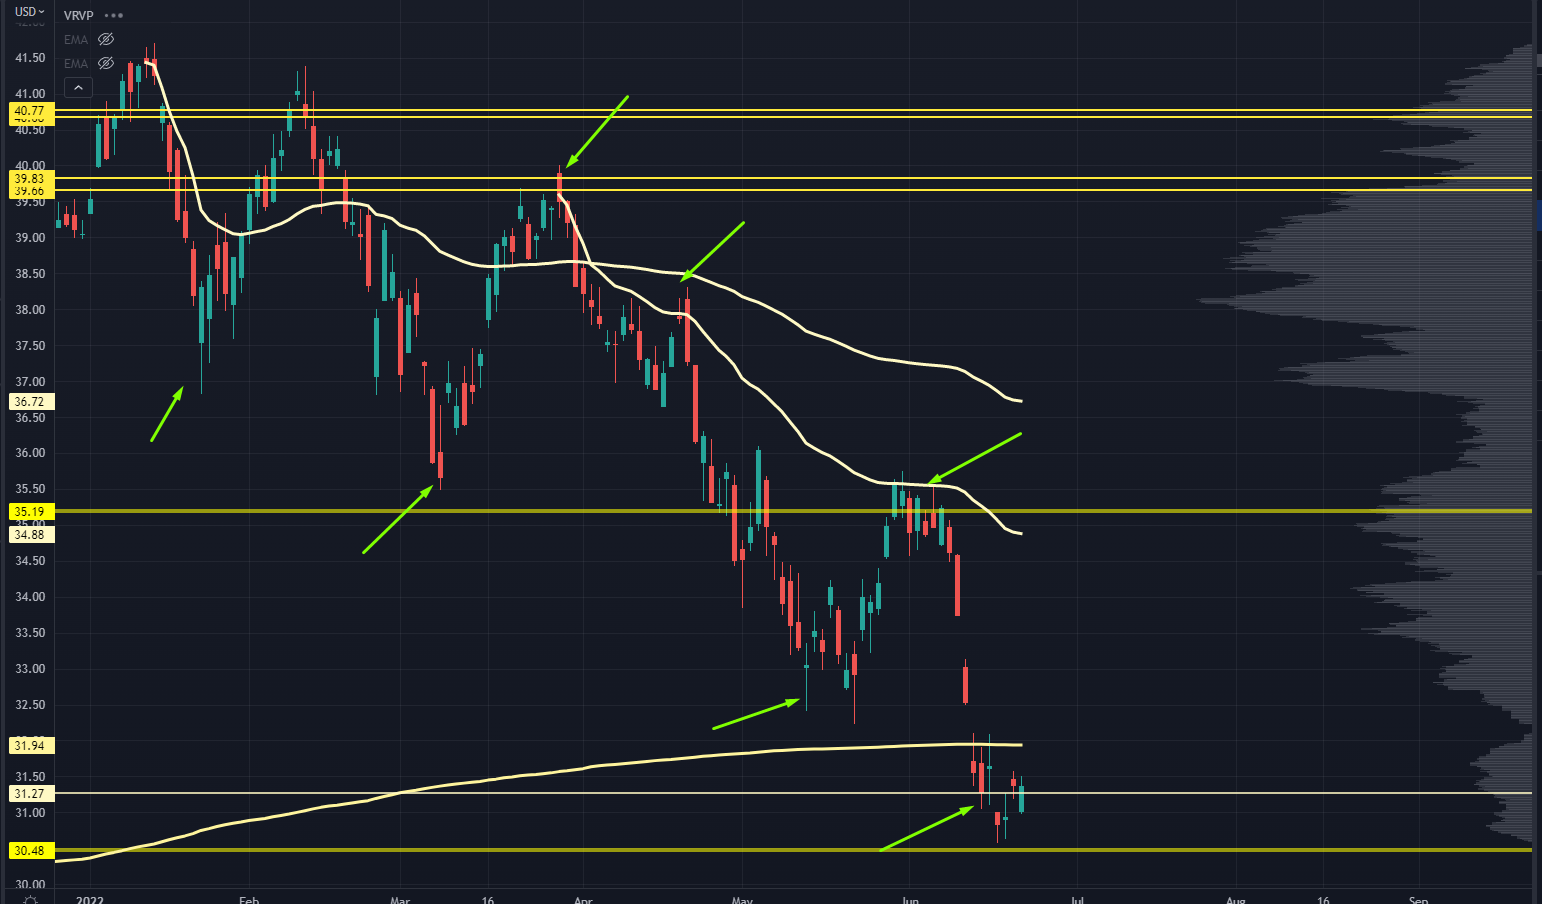
Let’s look at XLK, the SPDR Technology ETF:

XLT Chart
It should be clear this market’s been making new lower lows for the entire year.
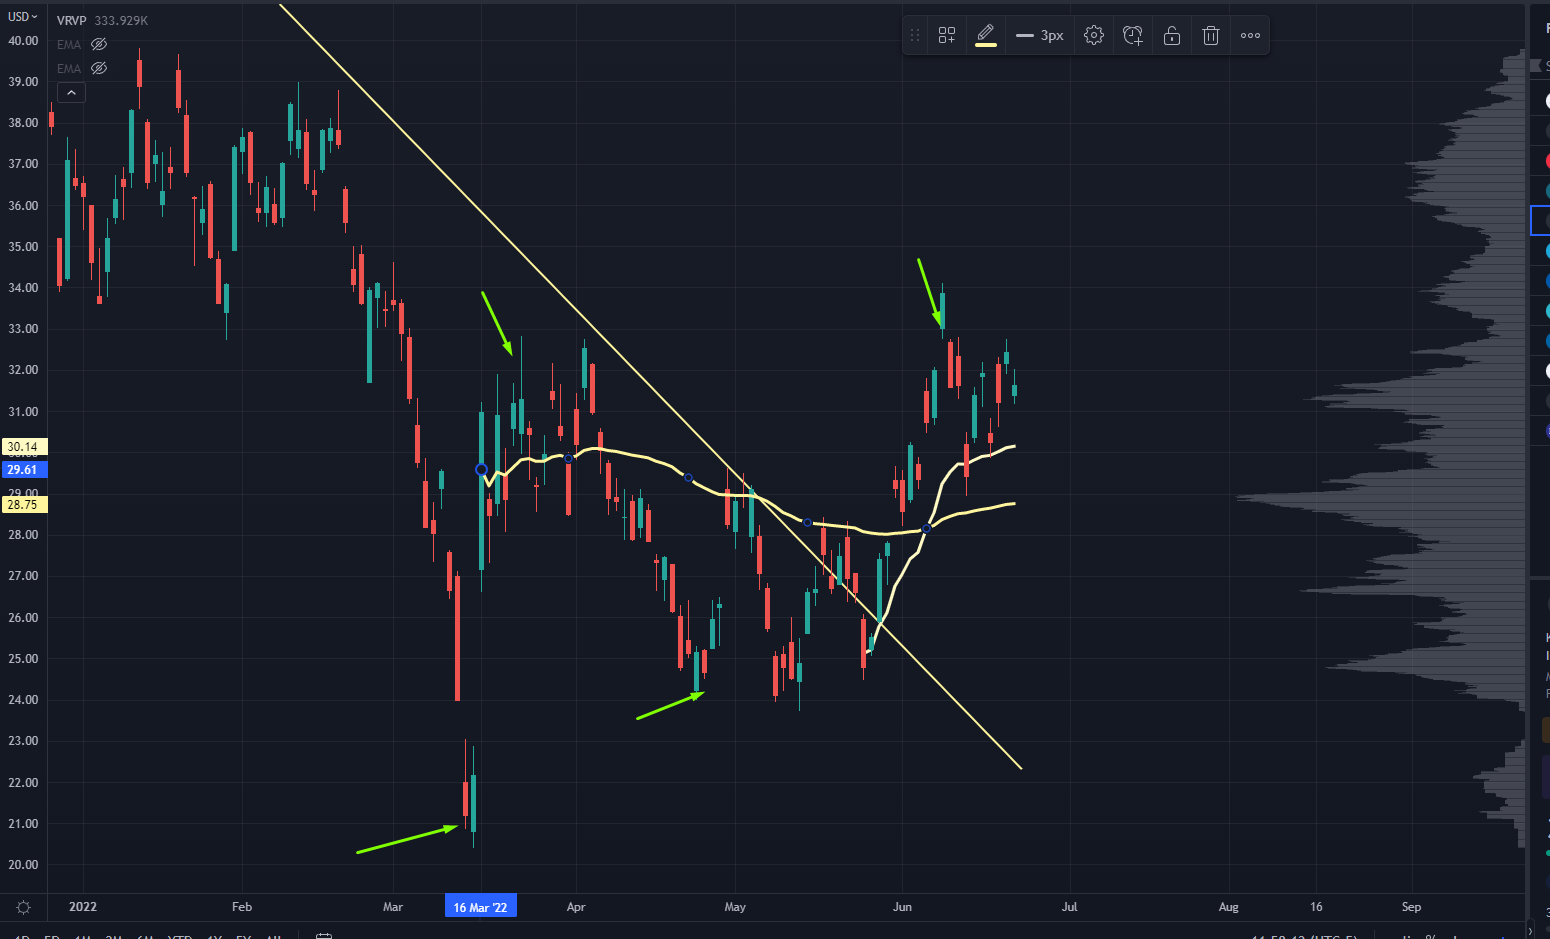
Meanwhile, let’s look at a different technology index:

ETF Chart
After a nasty move lower in March, this ETF hasn’t seen a retest or break of those lows — all while the broad markets are getting crushed.
So what’s this index… is it energy or commodities?
Nope… it’s Chinese Internet stocks.
Tech stocks have done terribly as the Fed gets aggressive with interest rates — except in this pocket.
Many names in this ETF are setting up for breakouts from longer-term bases.
This could be a “first-in, first-out” mechanic as well.
See, the Chinese Internet space was one of the first places to start a bear market. That happened in Feb 2021 while the rest of the market stayed bid.
Now that this index has built out a new class of stock owners, look for this to start seeing some upside momentum.
If that happens, you’ll want to know where to enter and where to take profits along the way… which is what our Market Roadmap shows us.
Go here to learn how it works.
Original Post Can be Found Here