SPY Chart
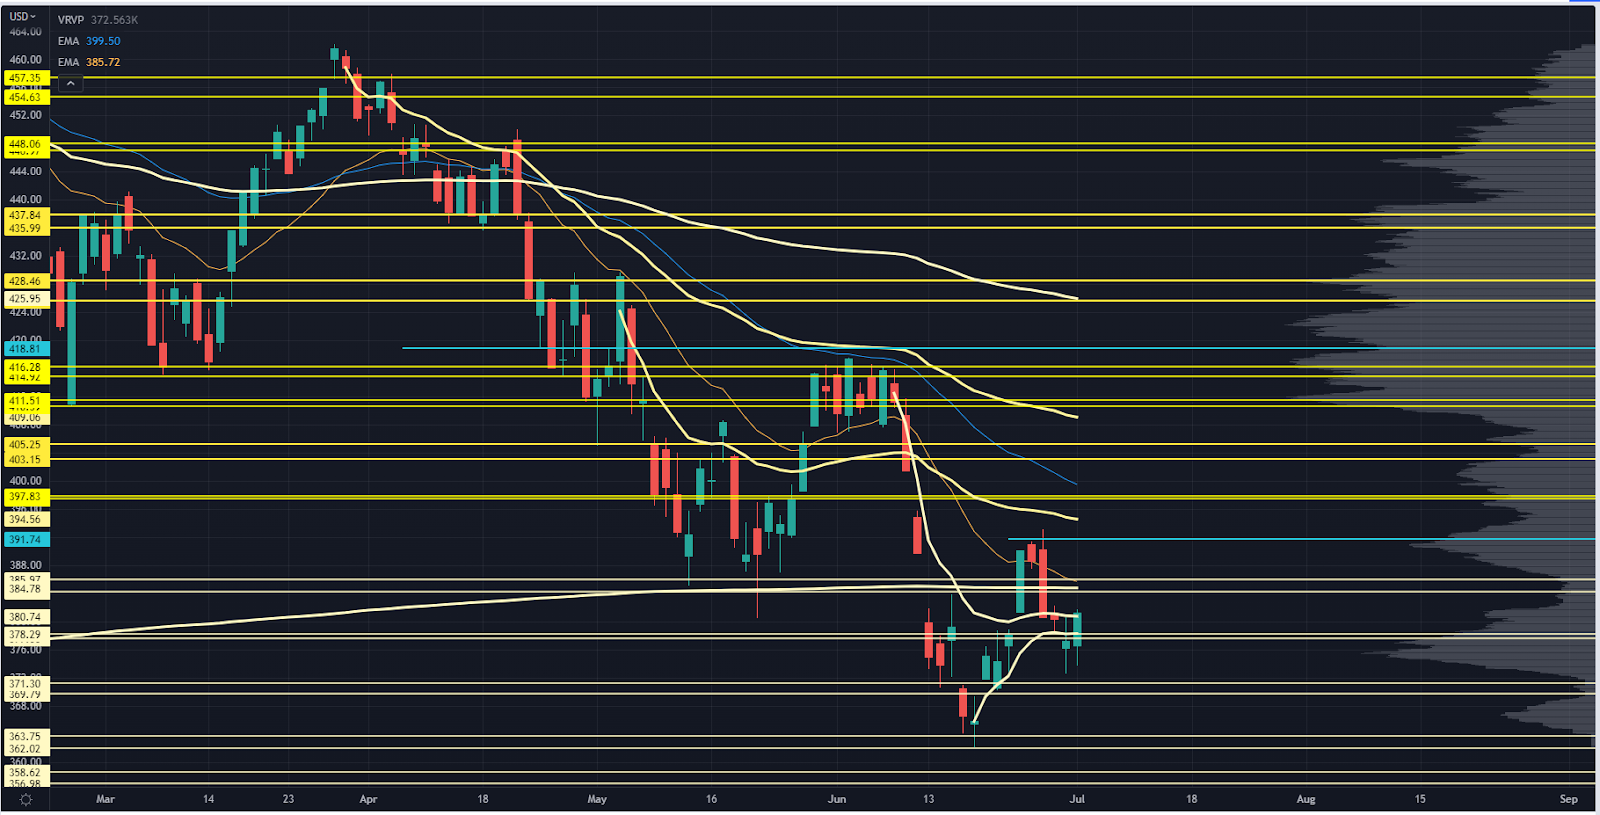
Equities are attempting to carve out a higher low.
I’ve been watching the swing Anchored Volume Weighted Average Price (AVWAP) from the recent lows.
While we cleared under it on Thursday, enough buying happened to get it back above that level.
I’m noticing some improved stock dispersion, meaning we aren’t all running on the same conveyor belt.
We’ll start focusing more on individual stock setups at Precision Volume Alerts.
Not much of the market structure has changed, and our Roadmap still provides clean levels to trade against.
Internal pivot level, key low volume node (LVN), and the March 2020 AVWAP.
I had this level lined up as a potential for “trapped inventory,” and that’s what happened.
If we test it again, look for the swing AVWAP from the May highs to interact with it as well.
This is an internal pivot level from May’s trading range.
This was going to collect the swing AVWAP from May, but we are now seeing the 50 EMA coming to reinforce that level.
Key high volume node HVN, pivot resistance from the May range, and we will catch the swing AVWAP from the March highs.
Big internal pivot area and a key LVN.
Recent swing lows, although I wouldn’t expect a clean double bottom on this.
Instead, look for the divergence at the next lower level.
Key LVN and the August 2020 pivot highs.
If we retest the recent lows, this would be the first area to look for a stop-loss run.

QQQ Chart
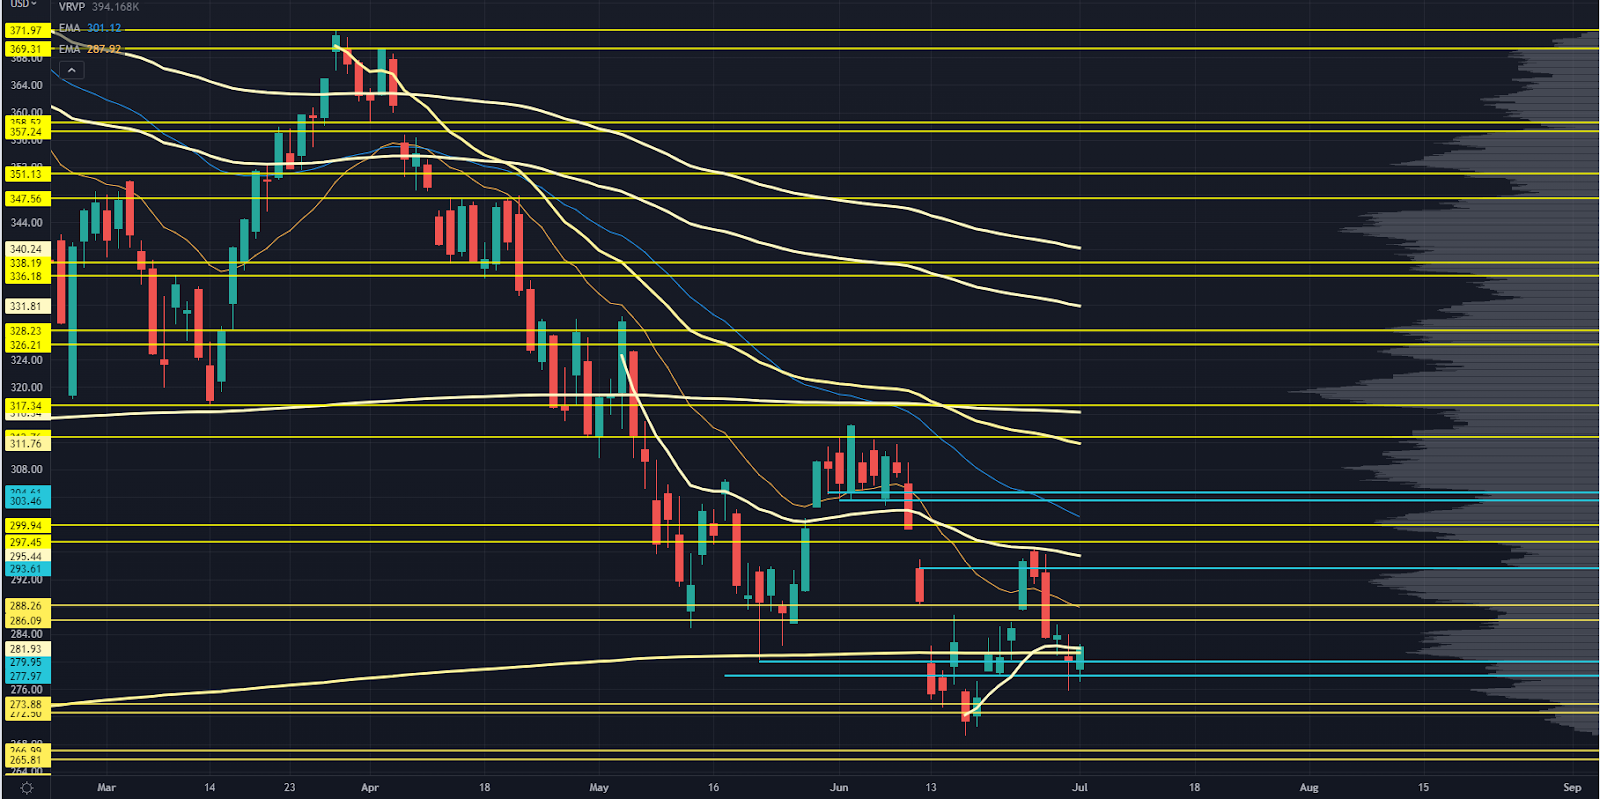
A key LVN, 20 EMA, and internal pivot level.
New level is marked in blue, which will be the swing AVWAP from the May highs.
Gap-fill, volume shelf, and 50 EMA in play.
June range prior support, and if we get enough time, it will grab the late March Swing AVWAP.
I’m not trading against this — just using it as a reference point because buyers have shown up here on an intraday basis.
There have been 4 days total with a close under this zone, so it works as a good over-under level.
Swing low retest, but I would expect an overshoot if we hit it with speed.
The next “lower low” that could be worth a shot to the long side.

IWM Chart
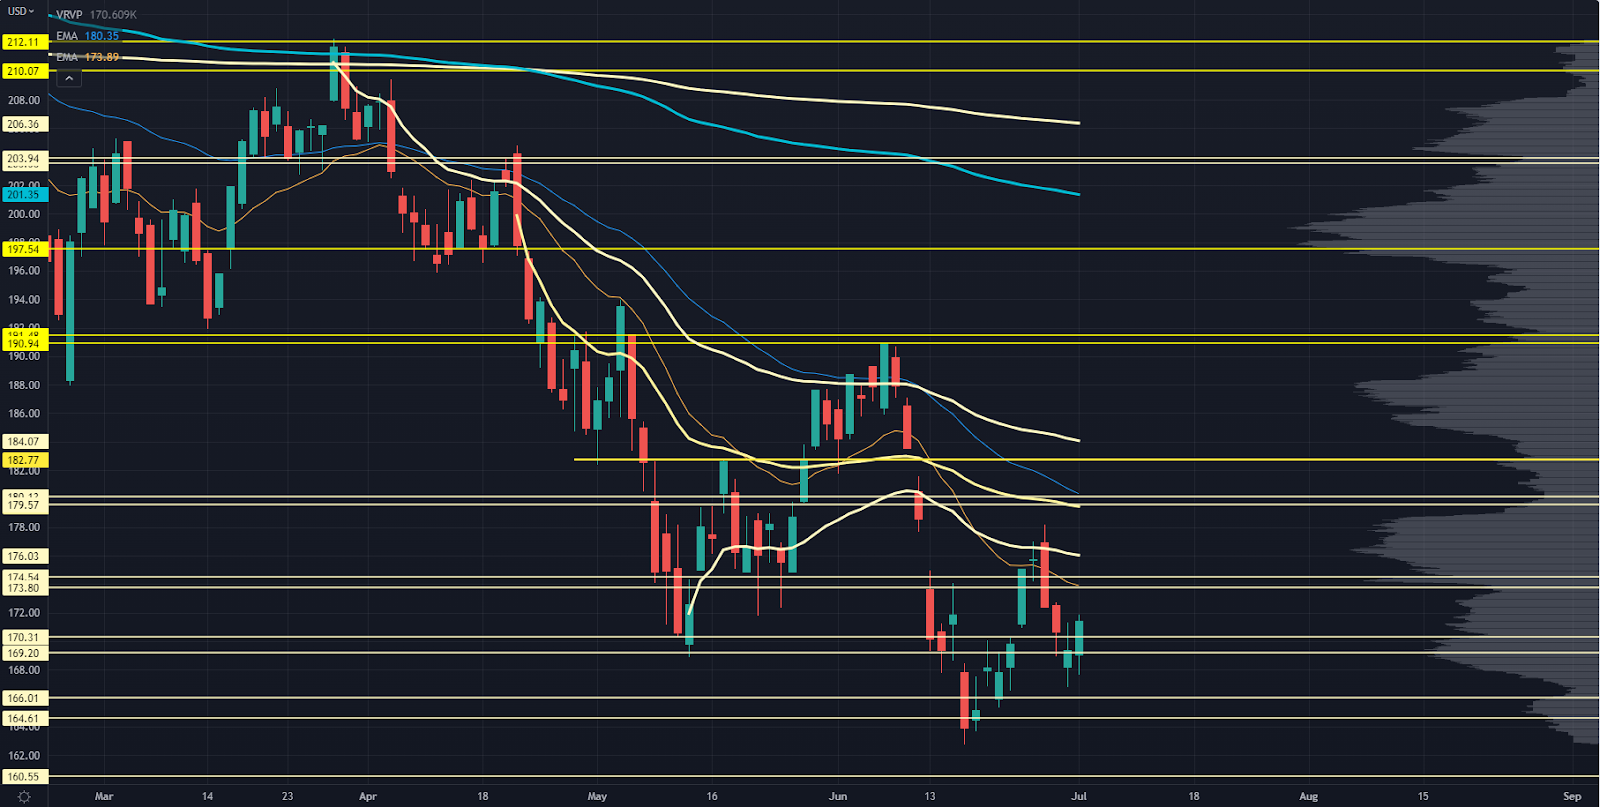
The Russell came close to filling the June CPI crash gap, and it’s close enough that I’d say responsive sellers showed up in size to get back at breakeven.
The market has the potential to make a higher low but still remains suspect until we see it break and hold above some upper levels.
Volume shelf and 20 EMA. It’s also the swing AVWAP from the May lows.
This one’s not marked on the chart, but we have seen some killer price responses from it recently.
It’s the CPI gap fill and will most likely be the swing AVWAP from the April highs, and the 50 EMA could come along for the ride.
I’d include 177 with this zone, but that would widen it too much. This LVN is a steep dropoff from the volume traded in the 173-179 value area.
Depending on the speed of the move, we could see the April AVWAP and 50 EMA come into play.
This is a developing zone that could work.
But if we have cleaned out enough inventory, we could jam higher into the 184-188 value area.
This level lines up with the late March swing AVWAP.

VIX Chart
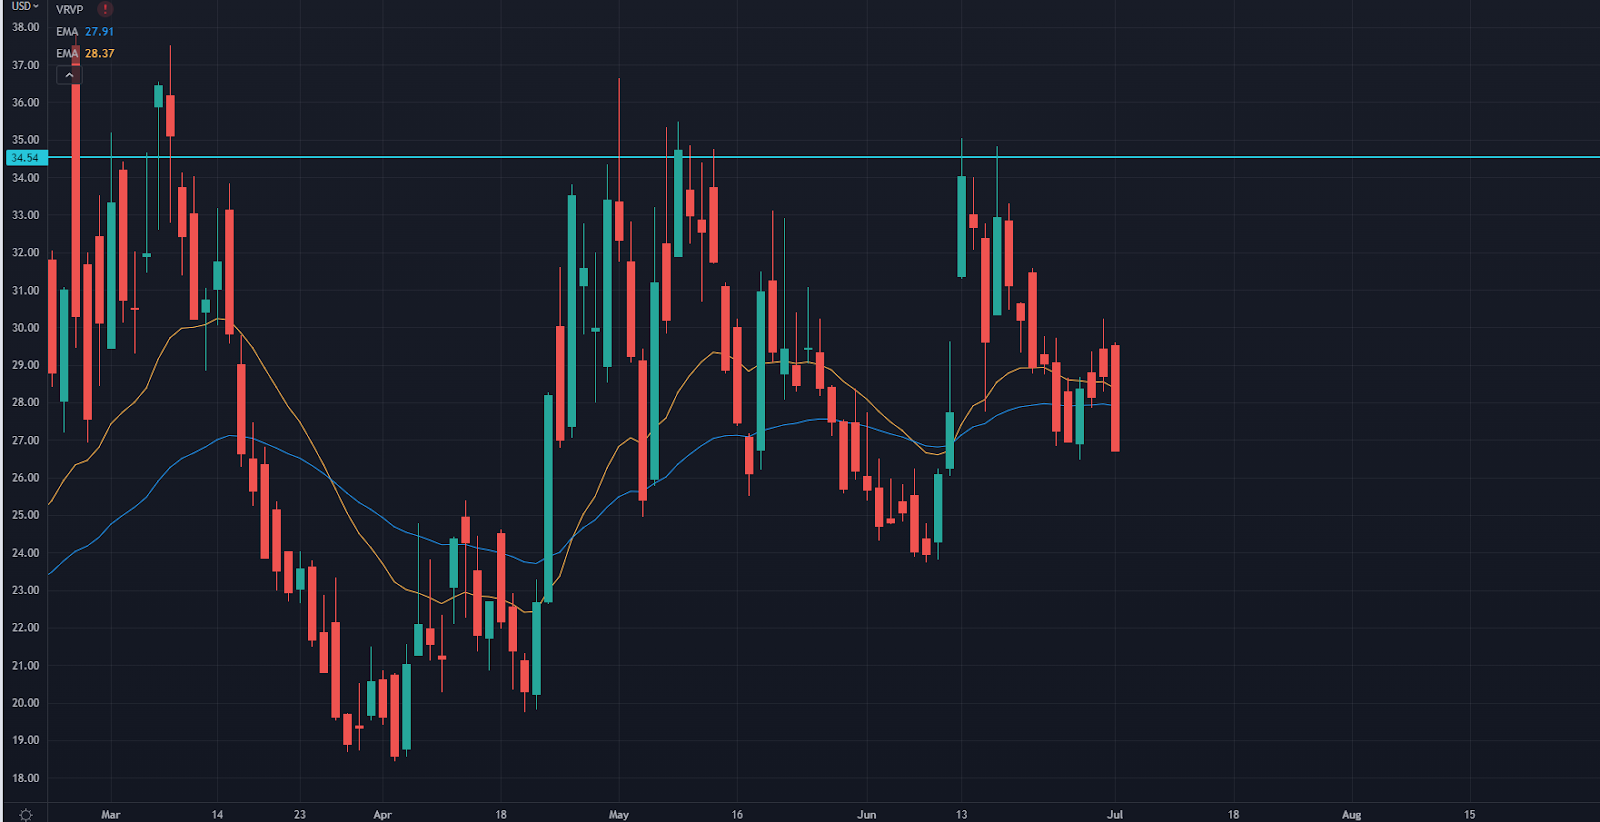
Remember: On a Friday into a 3-day weekend, it’s not a surprise to see spot VIX trade at the lows as the weekend time decay gets priced into the options market.
VIX futures were trading pretty close to it, and unless something truly comes out of left field, then we could see an attempt at the low 20s again.
This could drive equities higher strictly from the option flows.
That’s all for this week’s Market Primer.
Check out this webinar for further training on our Roadmap.
Original Post Can be Found Here