SPY Chart
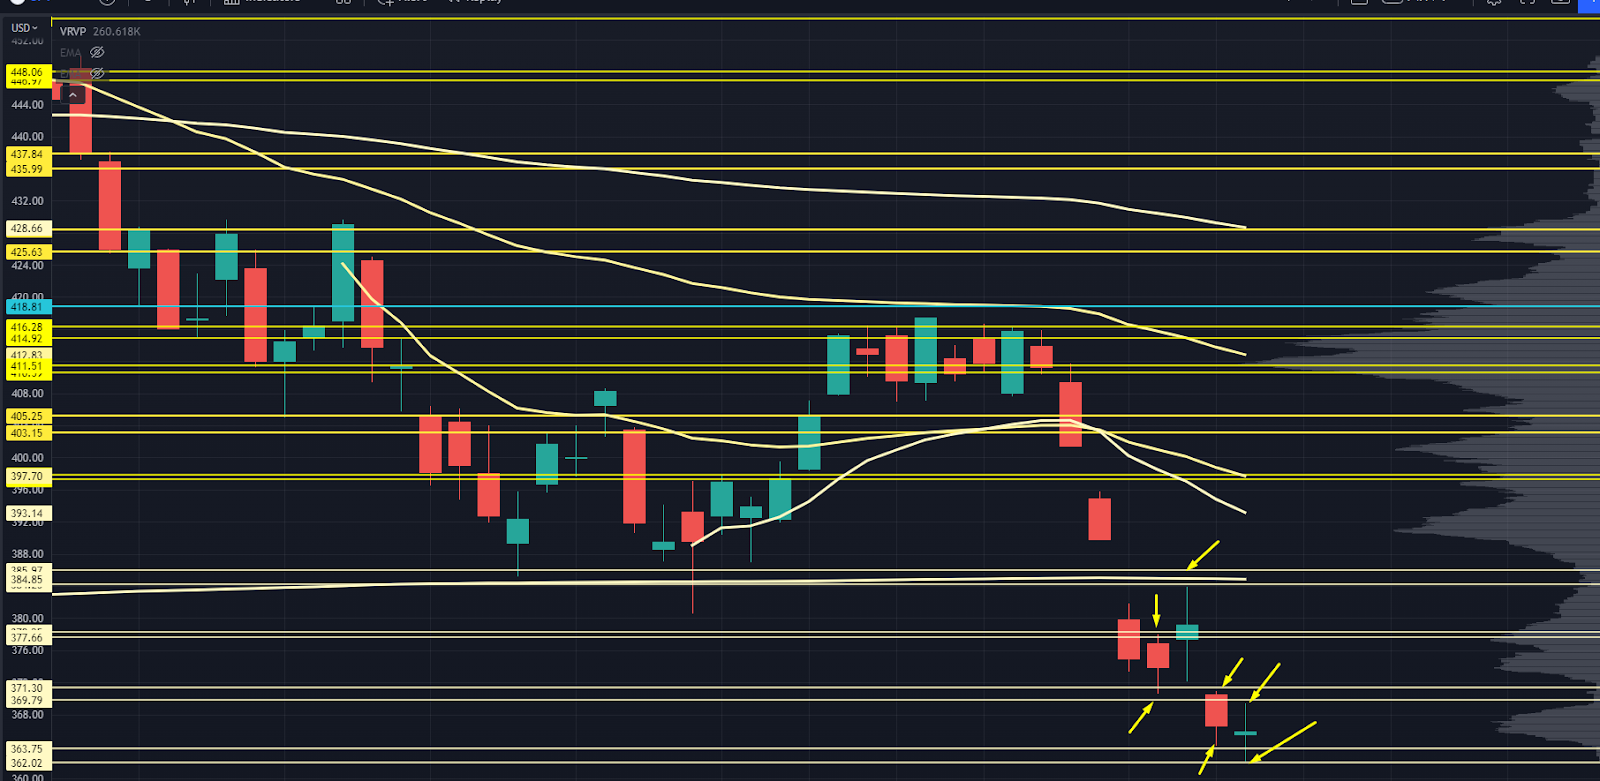
Let’s put the last week in perspective.
We had the hot CPI print, signaling inflation was sticking around and would force the Fed to adjust its policy.
The Fed meeting and quad witching expiration happened in that same week.
The S&P moved over 9% from high to low in three days… we can consider that a pretty good crash.
So with all of that going on, how did our Roadmap do?
It nailed every intraday high and low after Monday’s crash.
Remember: The Roadmap called these levels last week. They haven’t been adjusted.
If all you did was trade against those levels, you could’ve done exceptionally well while other market participants was freaking out.
Let’s drill down to the next levels to watch.
SPY Chart
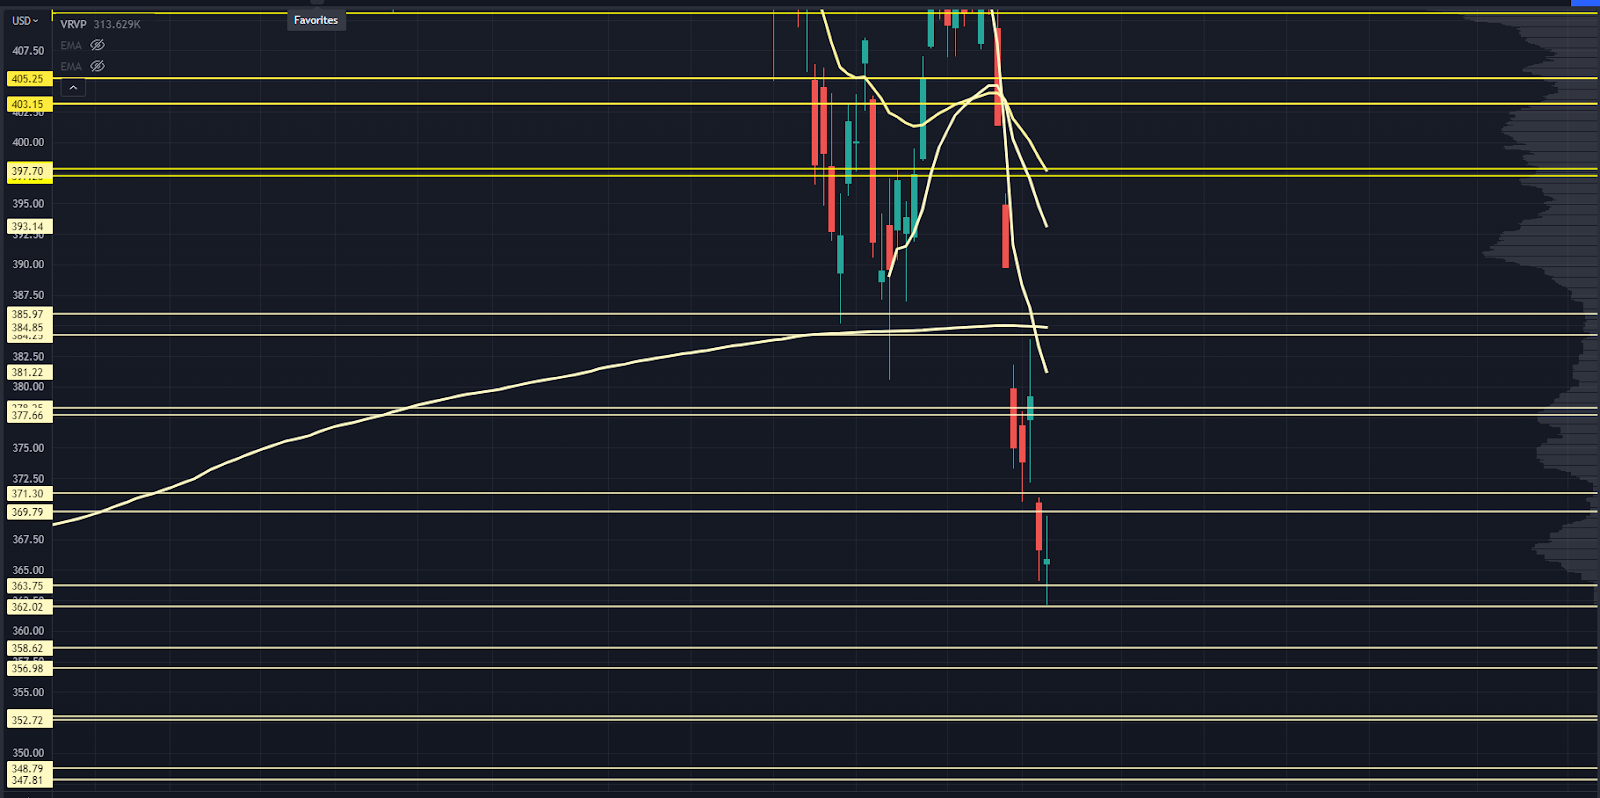
Friday’s response was pretty limp, given how oversold we were. We’re close to a local bottom, but we don’t know whether it’s here or another 5% lower.
Friday’s low is still a reasonable level to play. If we gap up on Tuesday and attempt a back and fill, that should be a low-risk long entry point.
Under that, we have 356-358 from a low volume node (LVN), and then another at 352-353. Given the market volatility, we could easily blow through the first one if we have enough downside energy, then collect the one underneath.
The next zone is 346-348, and then 340.
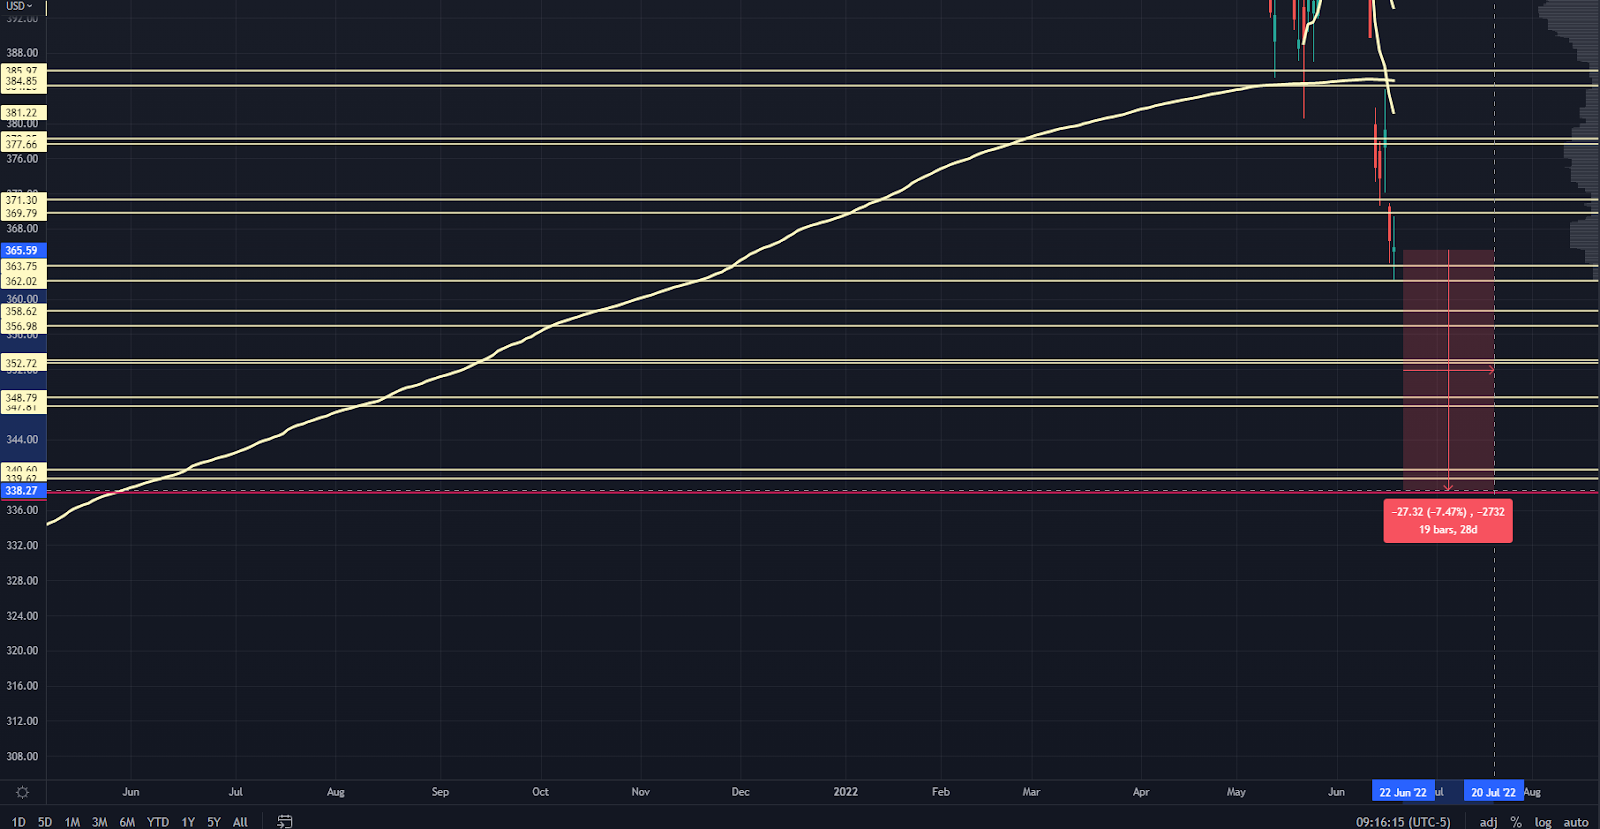
My chart has one level marked right at 338:
SPY Chart
Here’s why I’m looking at this:
SPY Chart
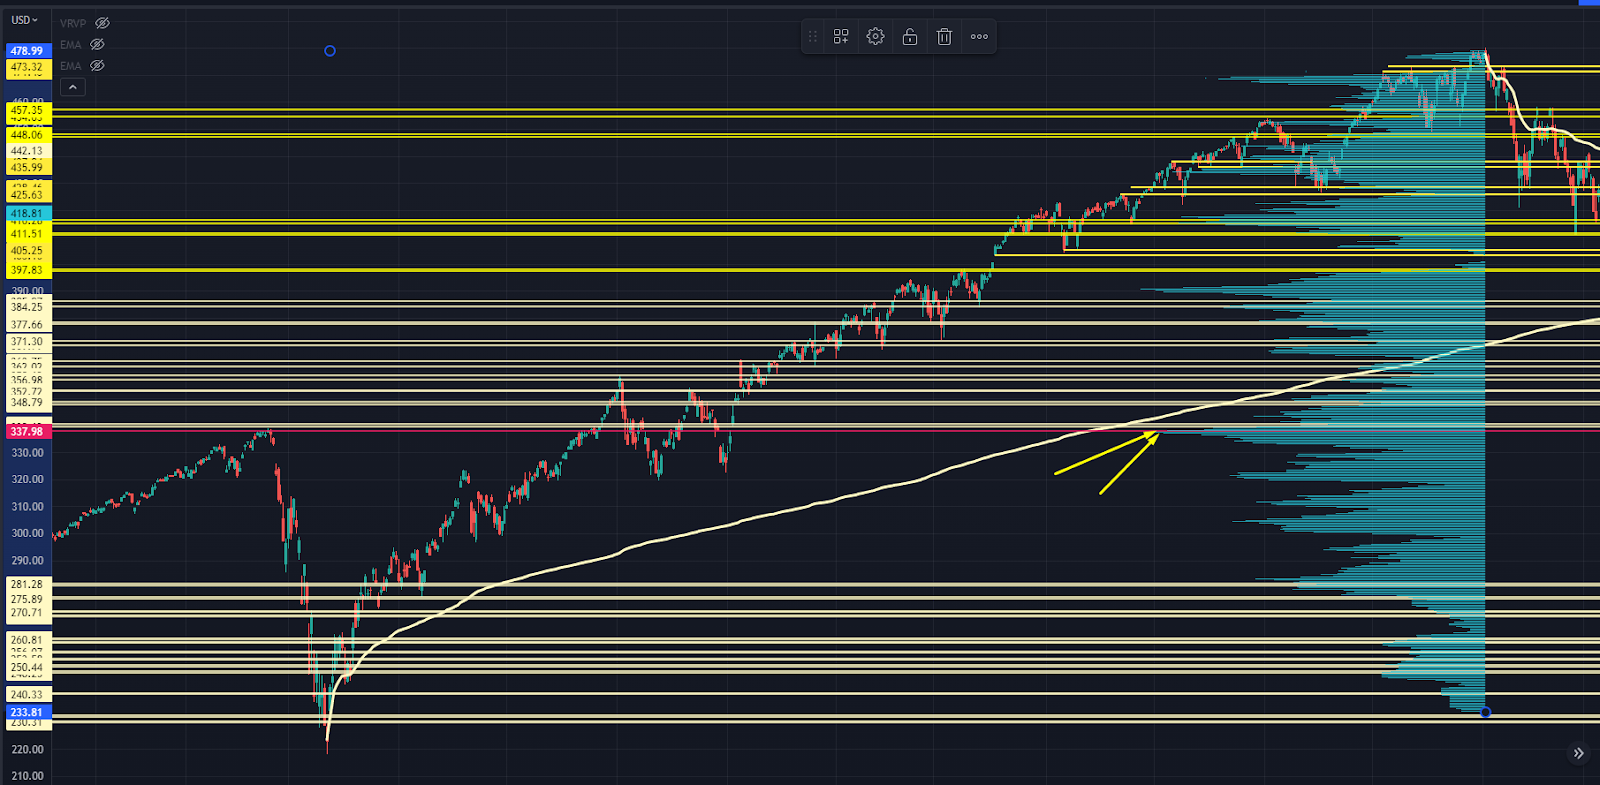
This is the high volume node (HVN) from the 2020-2021 rally.
We’ve recently seen these HVNs act as strong “magnets”…
So if the market truly loosens and we see crashy movement, this HVN would be the target.
Still, odds are we’ll see an “exhale” before that level is attempted.
To the upside, we have Friday’s high that is still a durable level. Above that is the 337 zone that is now picking up a swing Anchored Volume Weighted Average Price (AVWAP) as resistance.
Above that is Wednesday’s high and a zone we’ve had on our charts for a bit at 384-385.
From there, there’s an area where I don’t know how the market will trade.
If we get a proper bear market rally, I wouldn’t be surprised at a gap fill of last Friday’s close, which will line up with the AVWAP from the late May lows.
We also have a level at 397 that hasn’t been tested recently due to the overnight gaps. That level would coincide with the AVWAP from the May swing highs.
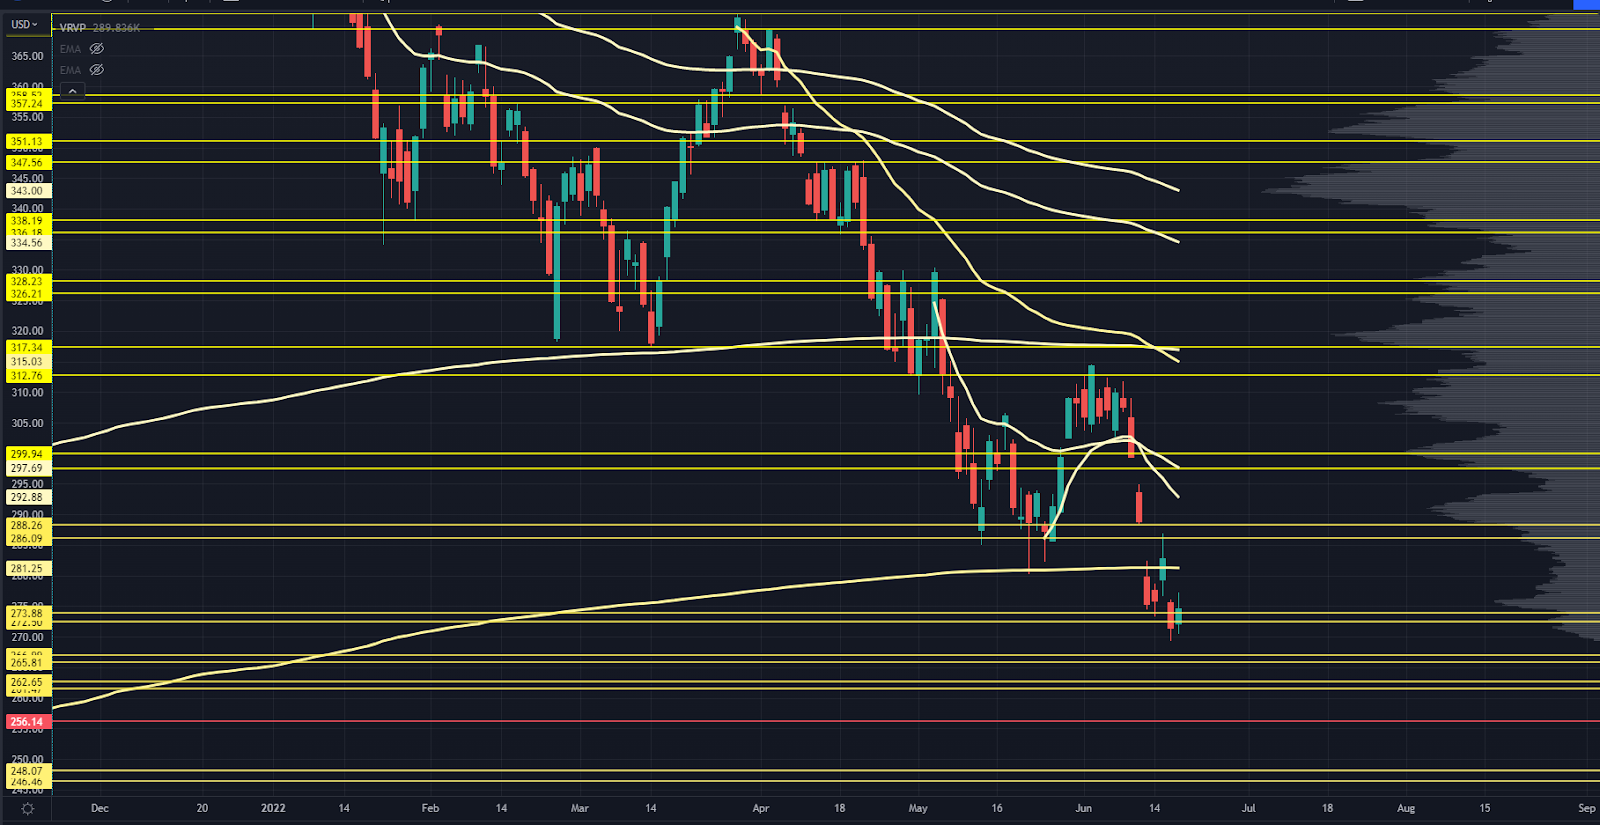
QQQ Chart
Our S&P levels were super clean, but on the Nasdaq… not so much.
Thursday saw some overshooting. I adjusted some levels to correspond with near-term price action response.
The market made some slight improvements on Friday, but it’s still a broken market.
Downside levels are at 266 and 262 — although if volatility continues to run hot, you can almost view that as a single zone.
I drew a key level on here — a massive volume shelf and price support.
If the Nasdaq loses that, we could see a fast move down to 248 since there was barely any volume traded in between them.
To the upside, we have Wednesday’s high and a gap fill from Monday in play, which will line up with the swing AVWAP from the May lows.
Above that would fill last Thursday’s gap down and the swing AVWAP from the early May highs.
From there, we hit congestion from the swing highs, the AVWAP from the 2020 lows, and the March highs. That would be a crucial test for any bear market rally.
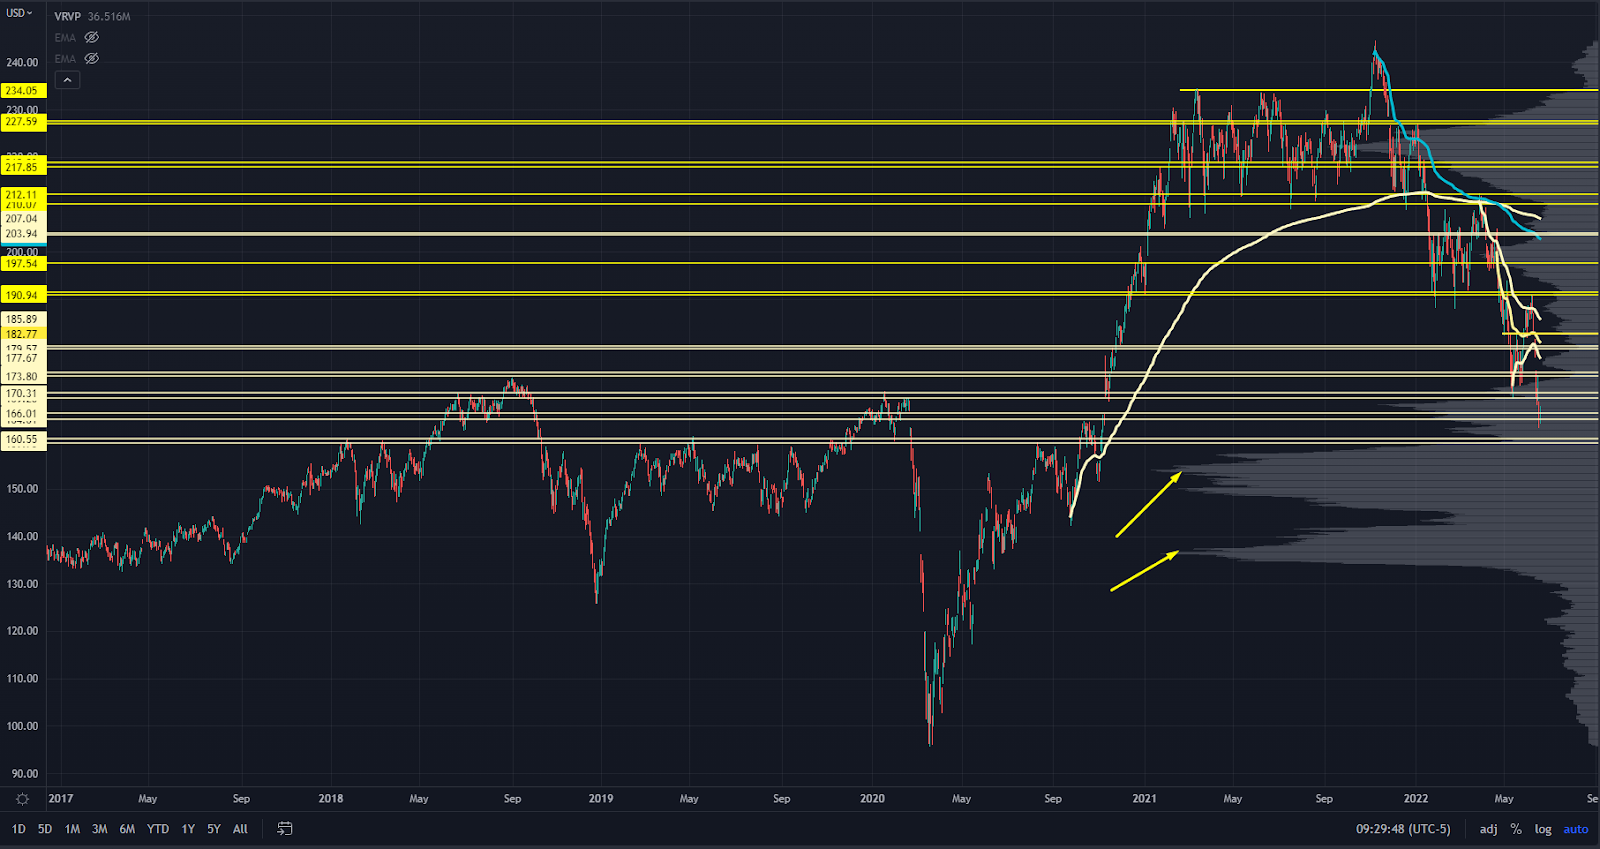
IWM Chart
Just underneath IWM’s price are two monster value areas where I expect selling to slow.
The Russell has effectively round-tripped from the 2020 election levels and is filling back into the prior trading range.
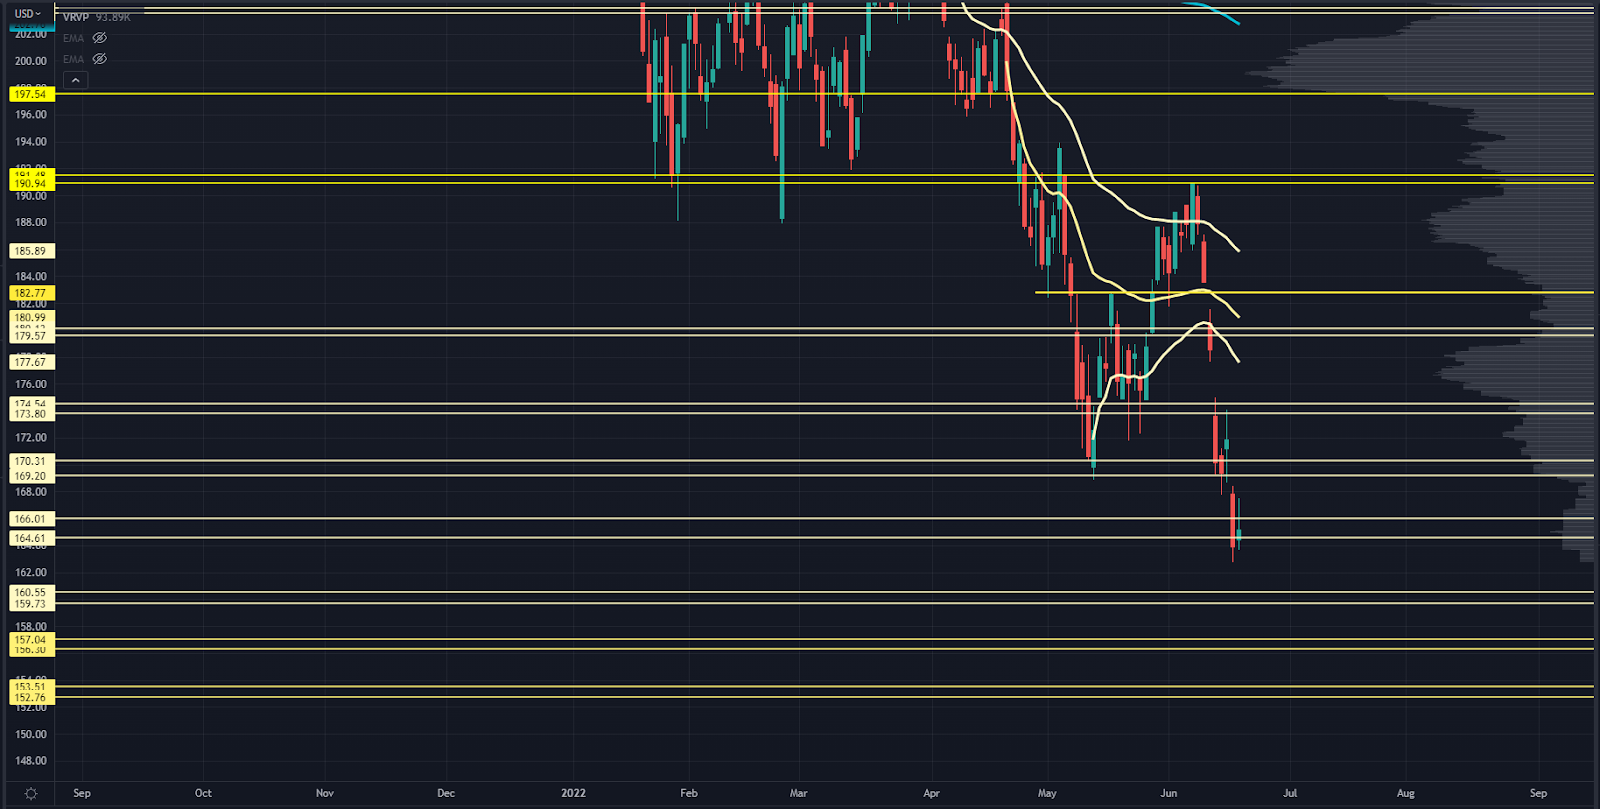
IWM Chart
A big level’s coming in at 159-160. Underneath that is 156-157, then 152-153.
These are pretty well spaced apart, so they should capture intraday pivots pretty well.
To the upside, we have a retest of the May low at 169-170, then last week’s high comes into play…
Probably collecting the Anchored Volume Weighted Average Price (AVWAP) from the May lows along with the other indices.
Above that is a wide-open space, and there will probably be some congestion — maybe at 177…
But I don’t have a good read on that just yet.
177 is last Friday’s low with a gap fill just above it, and that will pick up the April swing high AVWAP.
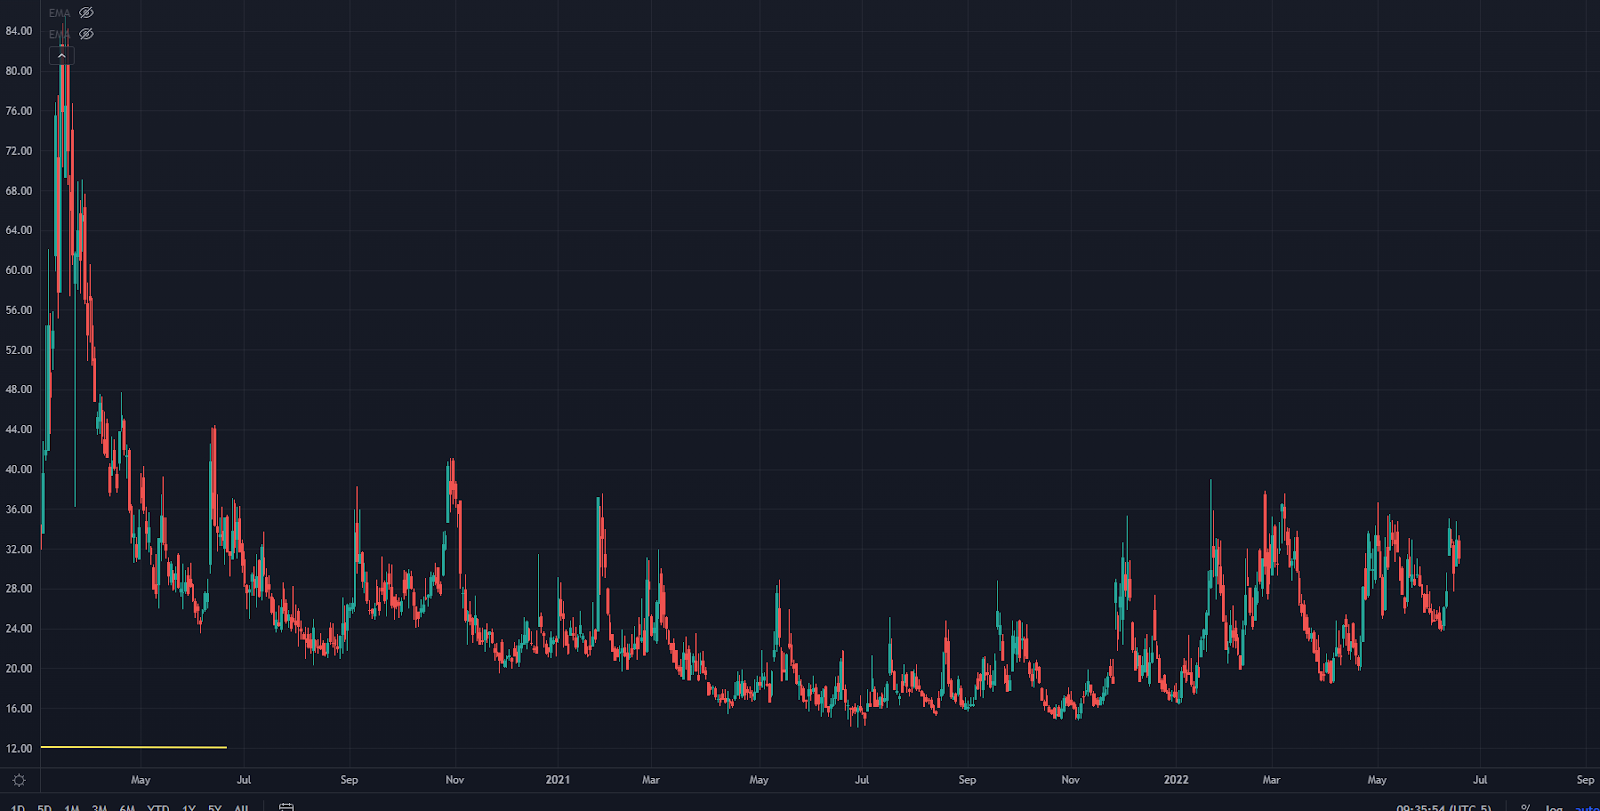
VIX Chart
I thought we’d see the VIX drop due to event-based risk post-Fed, but it did the opposite.
That clued me in to more potential downside.
We’re now back at the past two years’ range highs, and we’re coming to a crossroads in hedging products.
Is the smart money acting complacent and stupid…
Or will the hedging demand taper to the point where it drives a move in the overall markets?
One theory going around in options trader circles is that there was a ton of stuck short gamma into June options expiration.
Think about it:
Say you sold puts in May, and the market bounced hard. You’re feeling pretty good about this, and you’ll let the exposure expire worthless into June opex.
Then, the CPI comes in hot, and the market crashes.
All of a sudden you’re forced to hedge or blow out of your positioning.
The theory is this:
If all the option flows are attenuated because so many contracts rolled off the books after opex…
You no longer have persistent supply from dealers and other players who were stuck short puts.
If that supply goes away, we could be set up for a squeeze in the markets.
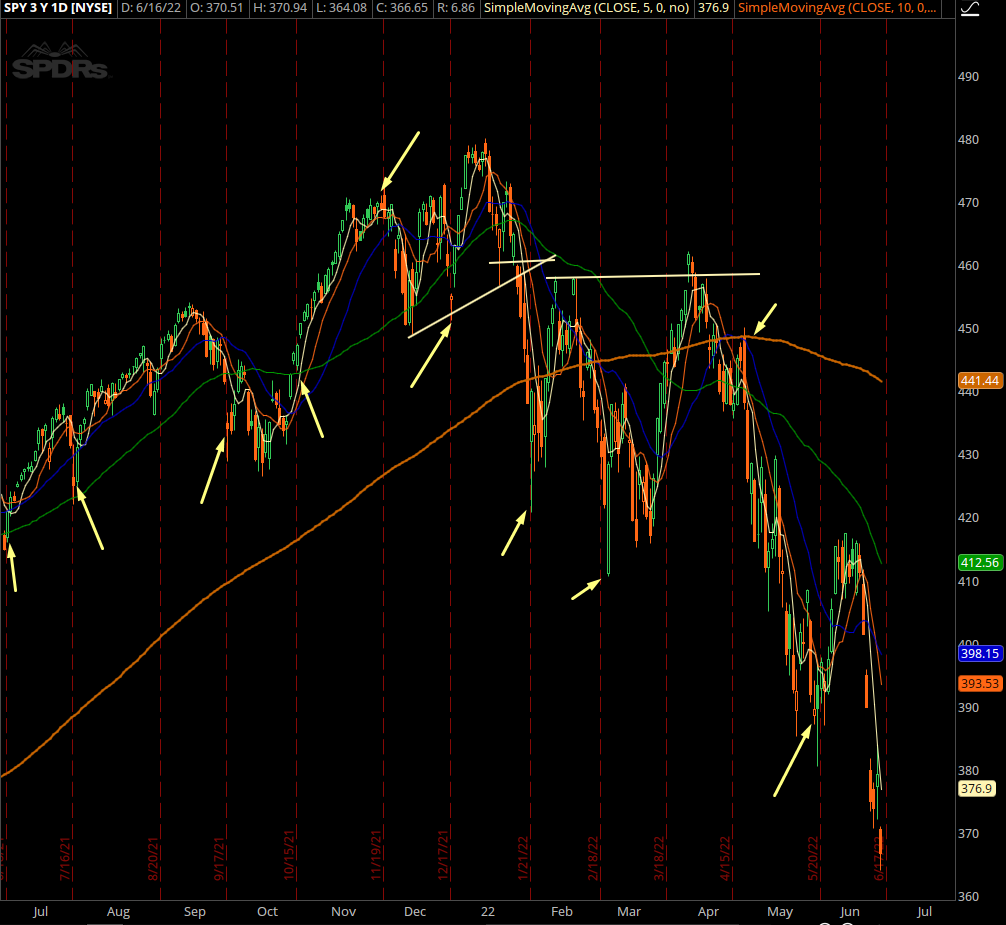
VVIX Chart
This chart shows how some of the market’s key turning points have been around monthly options expiration, so this has been “forward tested” with real data recently.
That’s this week’s Market Primer. One more thing:
Go here for a free training on the Trading Roadmap I used to analyze each index.
Original Post Can be Found Here