Stocks finished last week off by successfully testing and reversing off the key levels we’ve focused on this month.
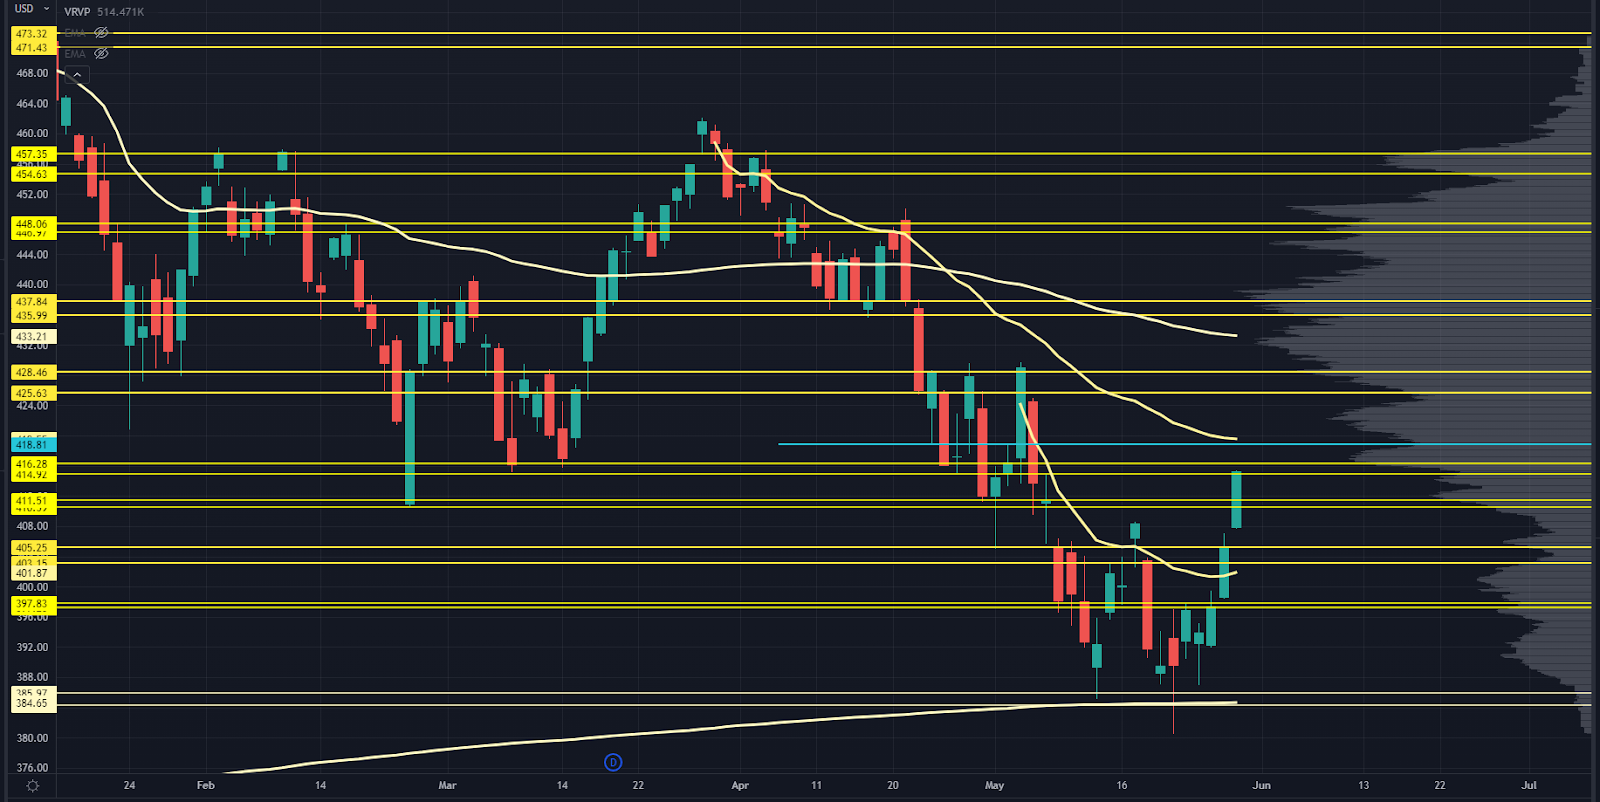
Now, they’re headed into massive zones with a ton of overhead inventory.
The question becomes: Will that inventory completely overwhelm the market as investors try to get back at breakeven…
Or have we seen enough deleveraging where prices are “chased” higher by FOMO buyers?
Let’s take a look at what our Market Roadmap’s saying…
SPY Chart
I was talking to some of my trader buddies last week, and we remarked how the “vibe” in the markets felt… different.
I know that’s a squishy term, but I think two things happened that benefitted markets overall.
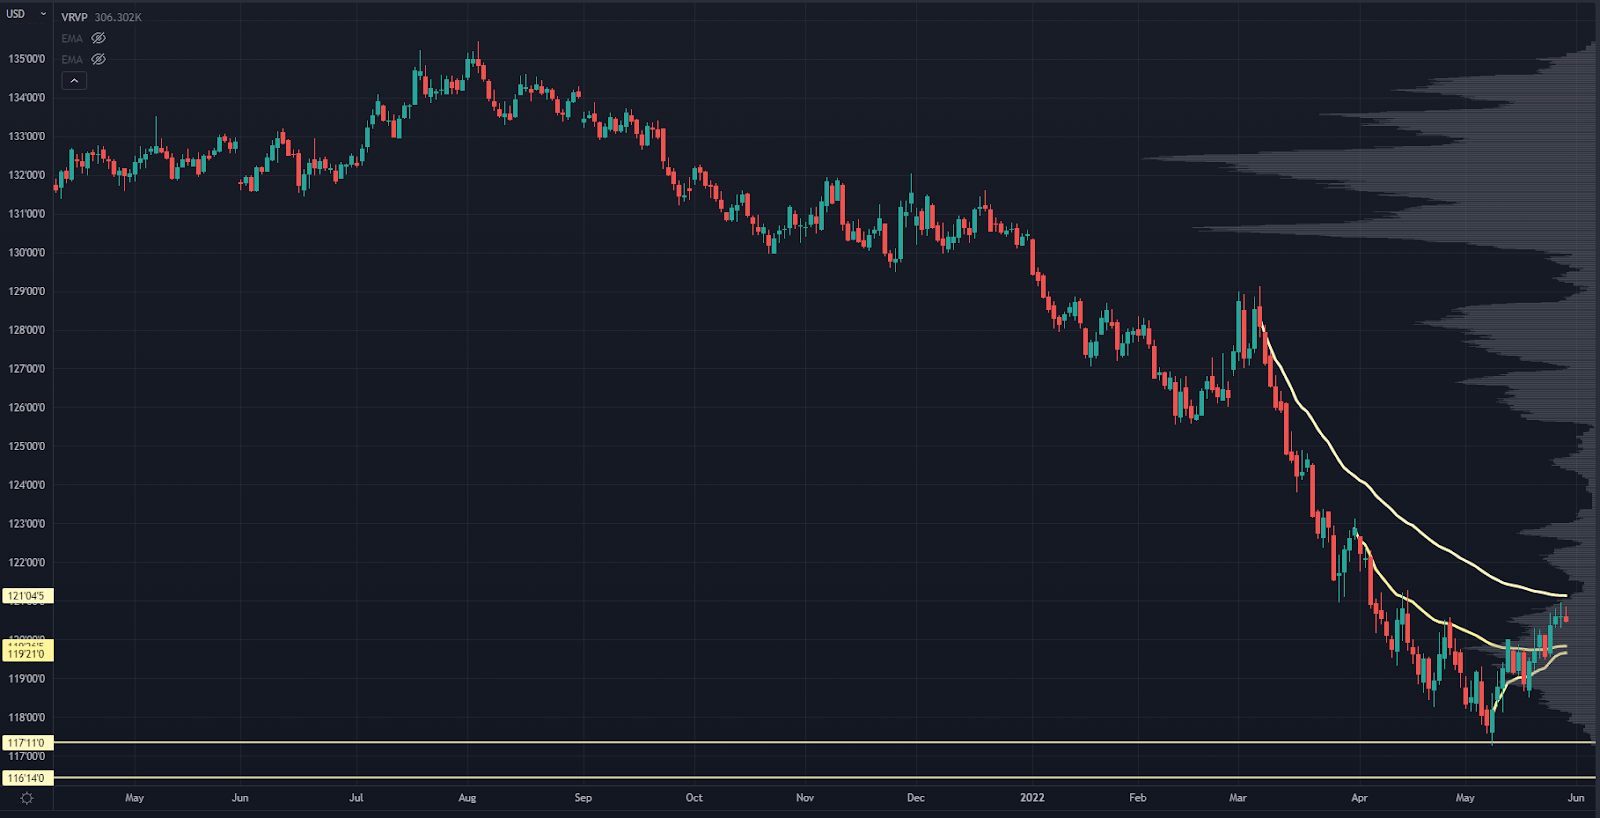
First, the bond market was no longer getting crushed. Here’s a look at the 10-year treasury future:
10-Year Treasury Futures Chart
I’m not shocked equities stabilized after bonds because it takes the “leveraged risk parity” blowup off the table.
The other thing is volatility got crushed (more on that in the VIX/VVIX section).
One way to treat volatility is as a liquidity measurement. If the market’s ranges are tight, there’s a ton of liquidity in the system.
It sure hasn’t felt like it this year, and there’s solid evidence the market “plumbing “could use some work.
But once intraday ranges cooled off and the forced institutional sellers disappeared, we saw a hard push to the upside.
The lower levels are all valid. We have 403-405 as the first support level…
But I wouldn’t buy on the first test because if we get back there quickly, a ton of stuck longs from Friday will be forced to unwind.
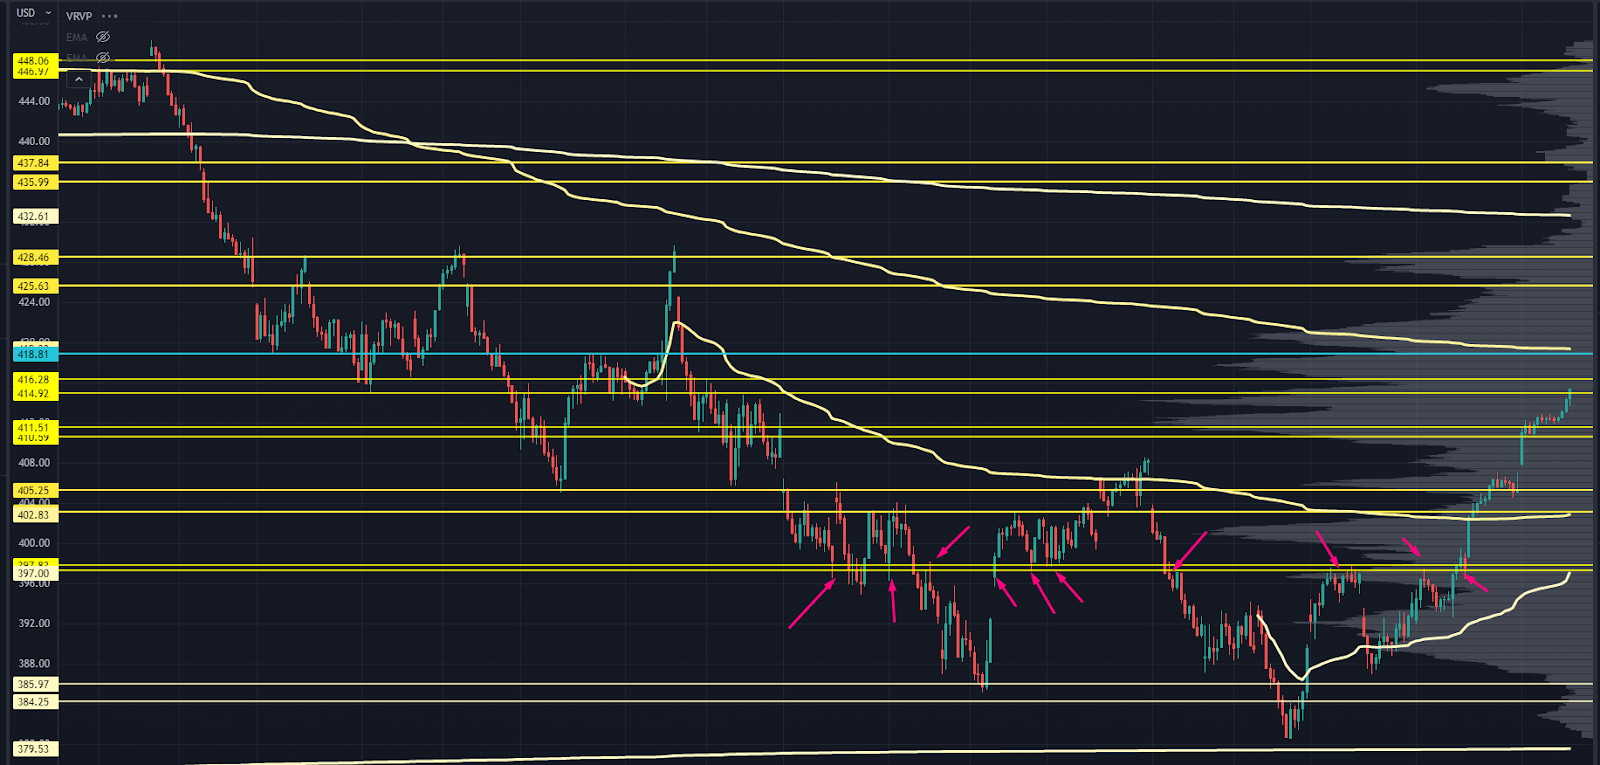
A more quality level is 397. Here is what it looks like intraday, so you can see how many times it acted as a pivot point:
Chart
And under that is the huge AVWAP we’ve been working with for three weeks now at 384.
To the upside, we have a ton of inventory between 416 and 418.
The latter also has the swing Anchored Volume Weighted Average Price (AVWAP) from the March highs and a local low volume node. That would be a great intraday fade on any Tuesday gap up.
Above that, we have 425-428, where we saw aggressive liquidations during the April-May trading range. That’ll line up with the AVWAP from all-time highs with enough trading time.
QQQ Chart
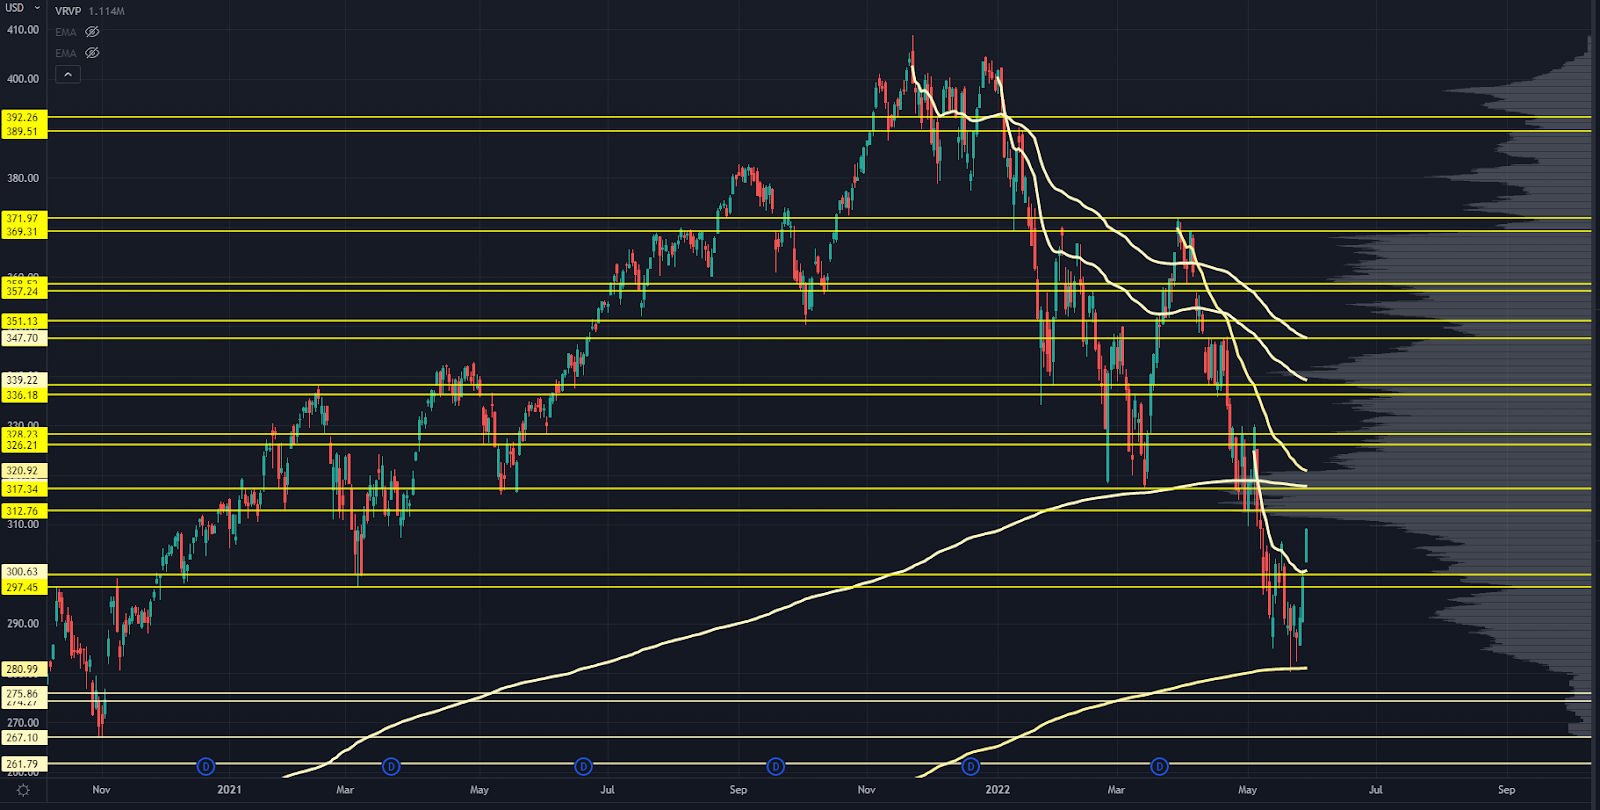
The Nasdaq responded massively off the AVWAP from the December 2018 lows, and we’re seeing some great followthrough.
I’ve got 300-297 as the first downside zone, and then we’ll key off the AVWAP again if we get there.
The upside is the most interesting part, though.
Over the past two years, most of the volume has traded between 312-320. How many owners are stacked up at hat level just begging to get out at breakeven?
We also have the swing AVWAP from the March highs, and the AVWAP from the March 2020 lows that’s curled over and is acting as resistance.
I will be very, very impressed if the Nasdaq can shoot through that in a single shot. If it does, we’ve got 326-328 coming up, and then the YTD Volume Weighted Average Price (VWAP) at 336-339.
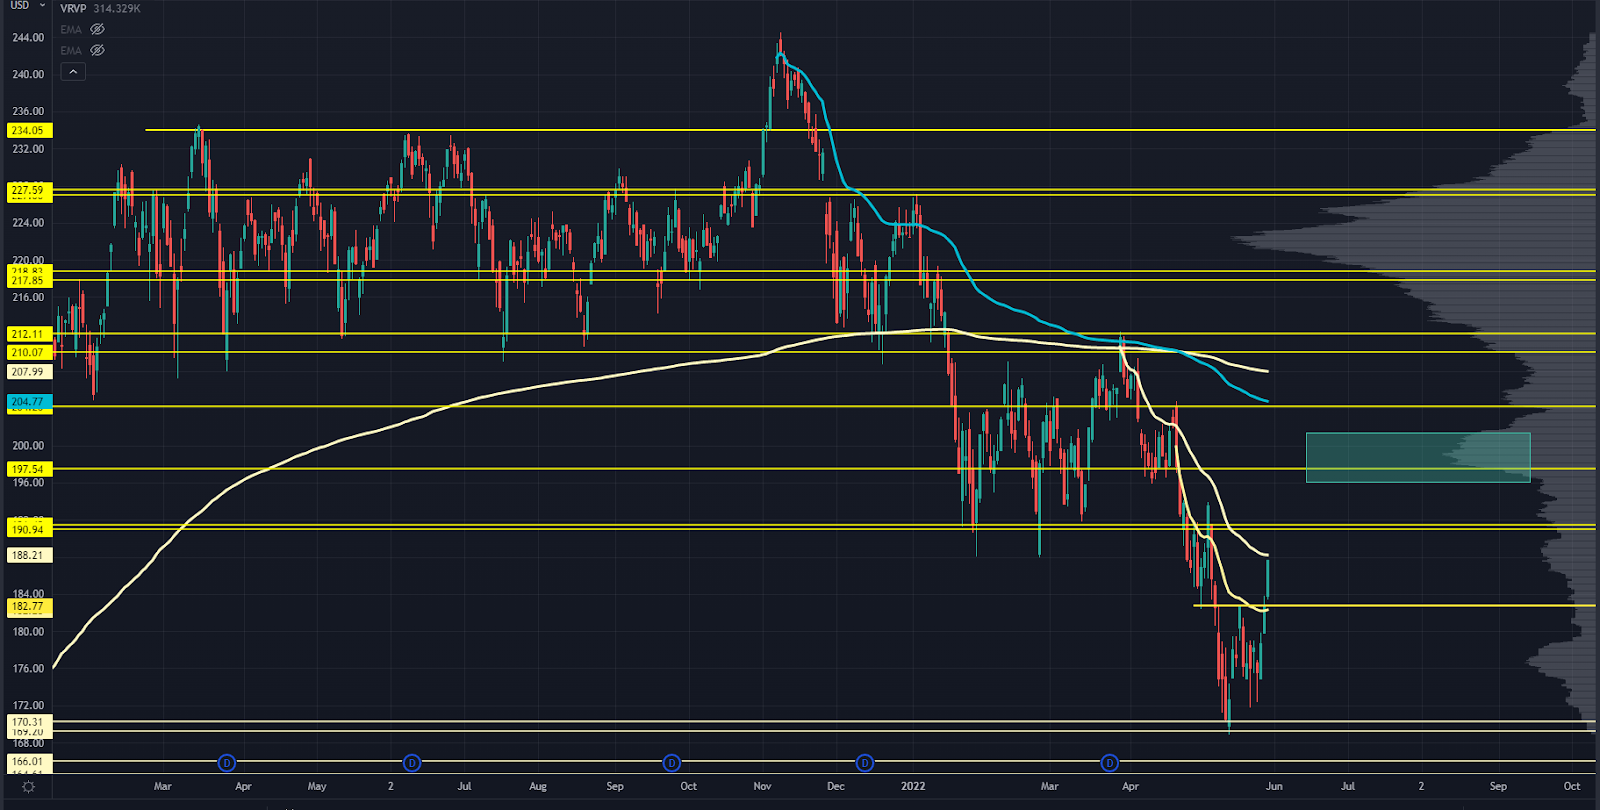
IWM Chart
The Russell could pull a fast one on us.
See, everyone and their mother will likely to be key off the 190 level, which is the prior support lows and could be a good re-short level.
The problem is, that level didn’t see a ton of volume… and there’s not enough incentive from owners at that level to bring in sufficient selling.
Instead, we could see the high volume node (HVN) to start acting as a magnet. That’s at 197-200 and would line up with the AVWAP from all-time highs.
If we hit the 190 level but don’t have a massive response lower off it, watch out for a second push higher.
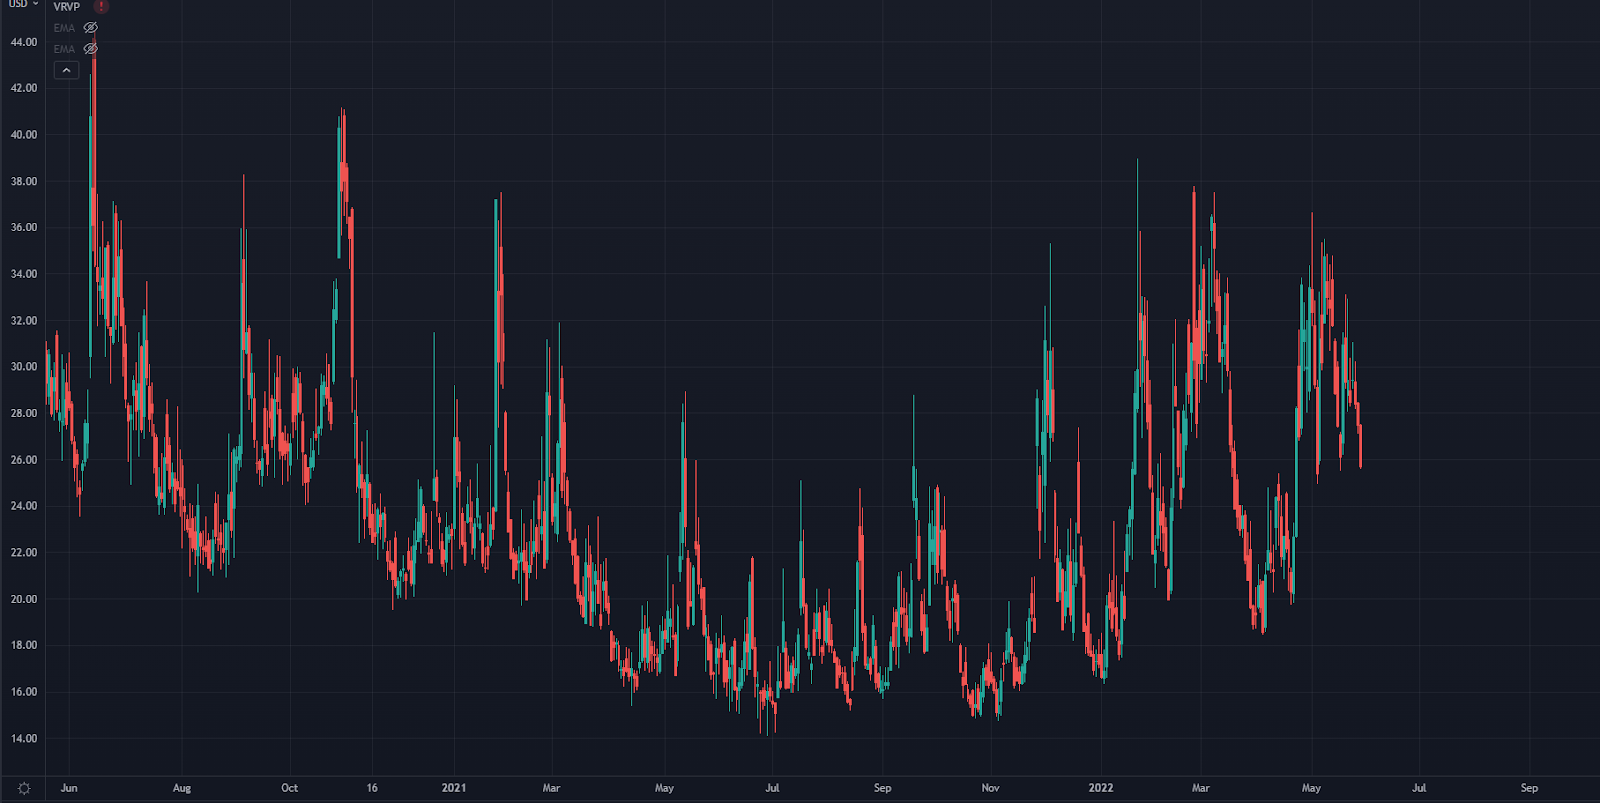
VIX Chart
The VIX rolled over but is still well off the 20 area that we’ve seen from recent tops in 2022.
If this really gets rolled over, you could easily see acceleration in stocks as the “vanna” component of options flow starts to come into play.
The more interesting market is VVIX, which we’ve been talking about for a while now:
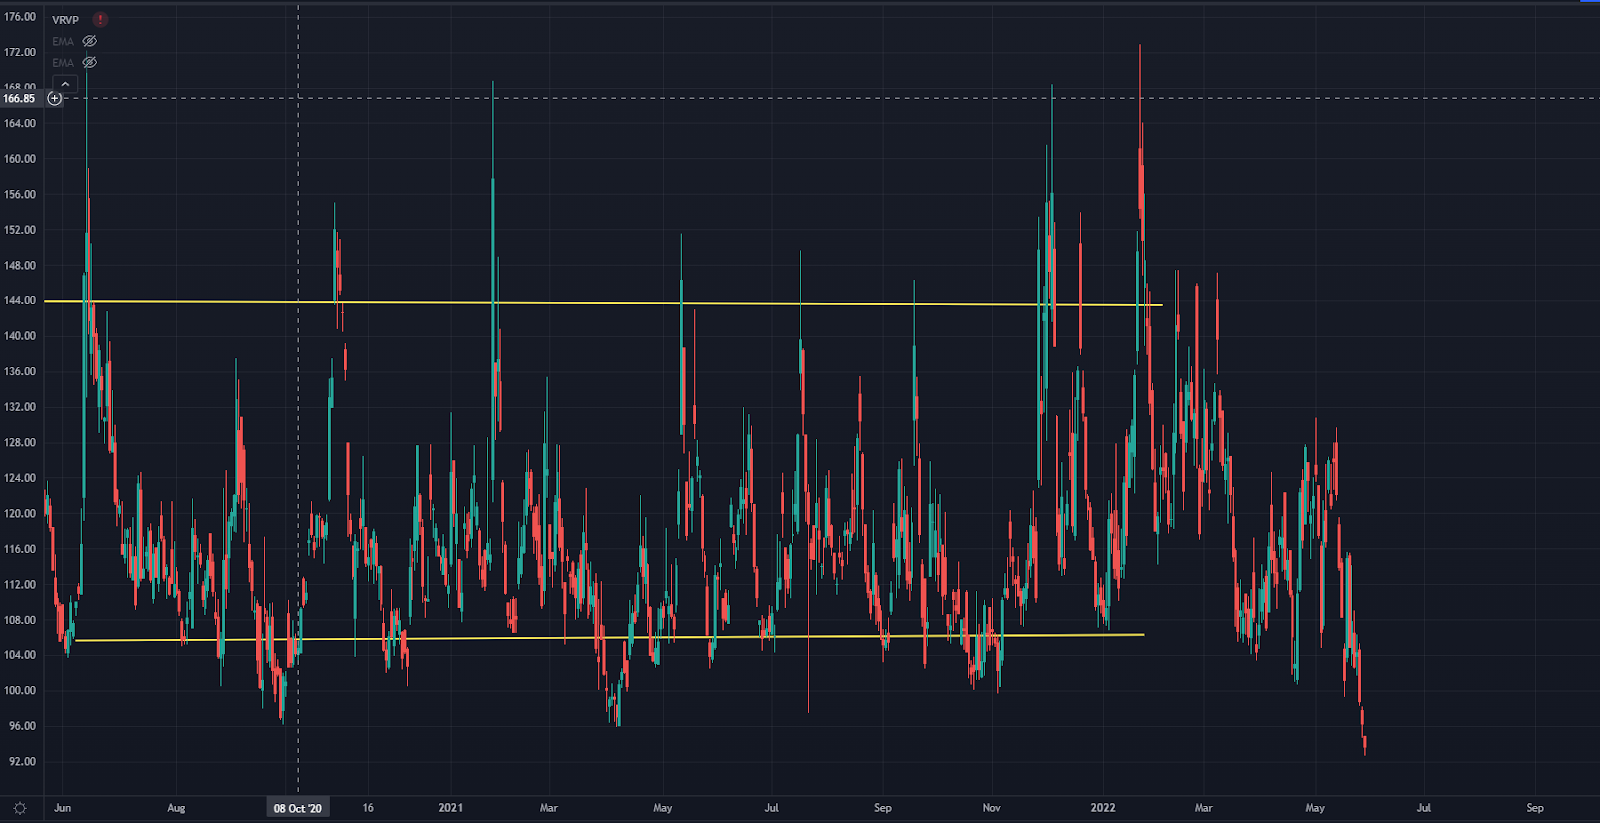
VVIX Chart
For well over a month, VIX options have seen a lack of demand. We’ve talked about this previously…
And we have now seen the lowest reading during the post-COVID trading era.
The winds are shifting here. A different volatility regime could be coming out now that we’ve seen the VVIX drop so hard.
For this thesis to play out, we’ll need to see index realized volatility head towards 20 and stay there, and the VIX to start building out a new range where the cap is about 28 instead of 35.
Original Post Can be Found Here