I have an indicator signaling a major potential bottom is setting up in tech stocks.
This is not a popular thing to say right now. Many high-growth names have been absolutely slammed, and some will take months or years to return to something resembling a bull market.
It’s a contrarian take, but I'd like to share an indicator that could provide guidance on timing a long position in tech stocks.
Before I reveal this indicator, there’s a timing mechanism to this.
Right now, inflation is the #1 issue as we head into the midterm election. This administration knows it…
And no matter how many times they try to blame Putin for it, we all know the costs at the pump and the grocery store will cause a world of hurt for the Ruling Class as November approaches.
Don't be shocked when they try to break the inflation trade over the summer.
If you want a deeper look into this, make sure to check out my Market Primer from earlier this week — look at the "Macro" section for how I think this will play out.
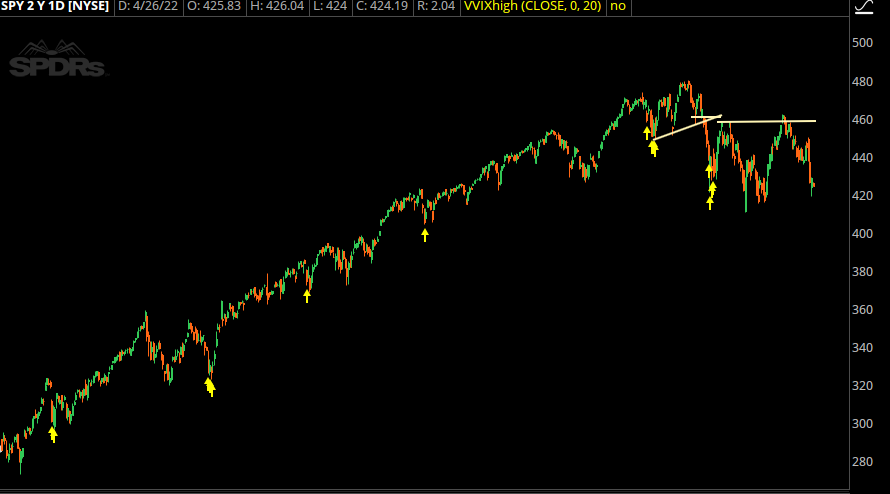
Now I've shared a trading indicator with you before, with the VVIX. Last year, when the market was getting hit hard, I highlighted how the 145 level on our Roadmap was huge.
>>>You can see that analysis here.
Here are the times when that long signal triggered:

SPY 2 Year Chart
Those have been great trading lows in the market, but we’ve seen more technical deterioration that led to a volatile trading range for the entire year.
Are we close to some kind of a trading bottom?
I've got an indicator that is a "once-a-year" kind of signal, and it’s been close to every tech market bottom over the past decade.
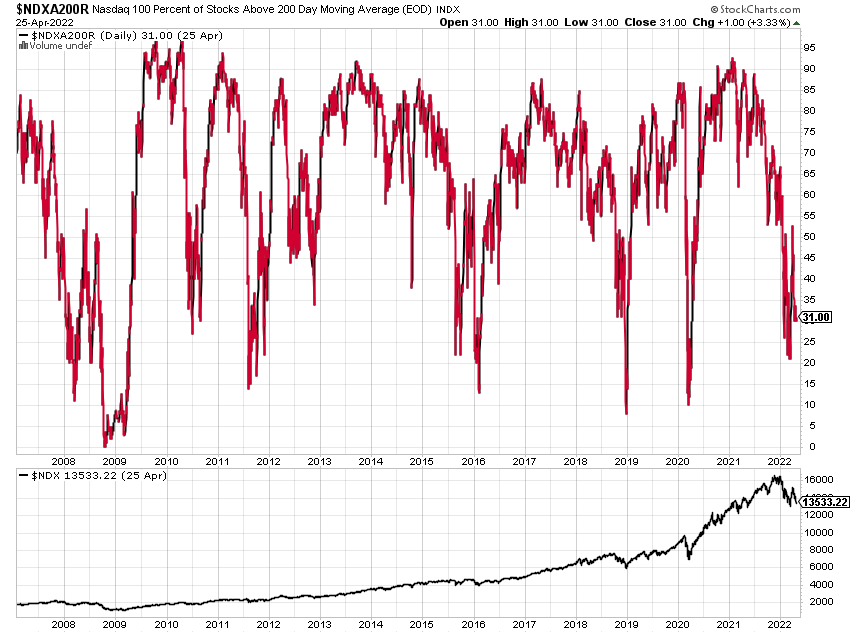
It's a breadth indicator called NDXA200R.

NDXA200R Chart
This shows us the percentage of stocks in the Nasdaq that are currently above their 200-day moving averages.
This tends to hang out above 70% in a normal bull market. But when markets sell off hard, many names will fall under this key moving average.
Anything under 20% has been a major bottom in the Nasdaq.
It marked the bottoms in 2009, 2011, 2016, 2018, and 2020. Throwing a ton of cash into the market at any of those times could have paid off over the long term.
Currently, we’re just above 20. It’s pretty close but it hasn't been a full washout. The markets could bottom here, but I wouldn't be surprised if we saw one more washout.
As an example, the semiconductor sector is breaking down and may be due for one more push lower.
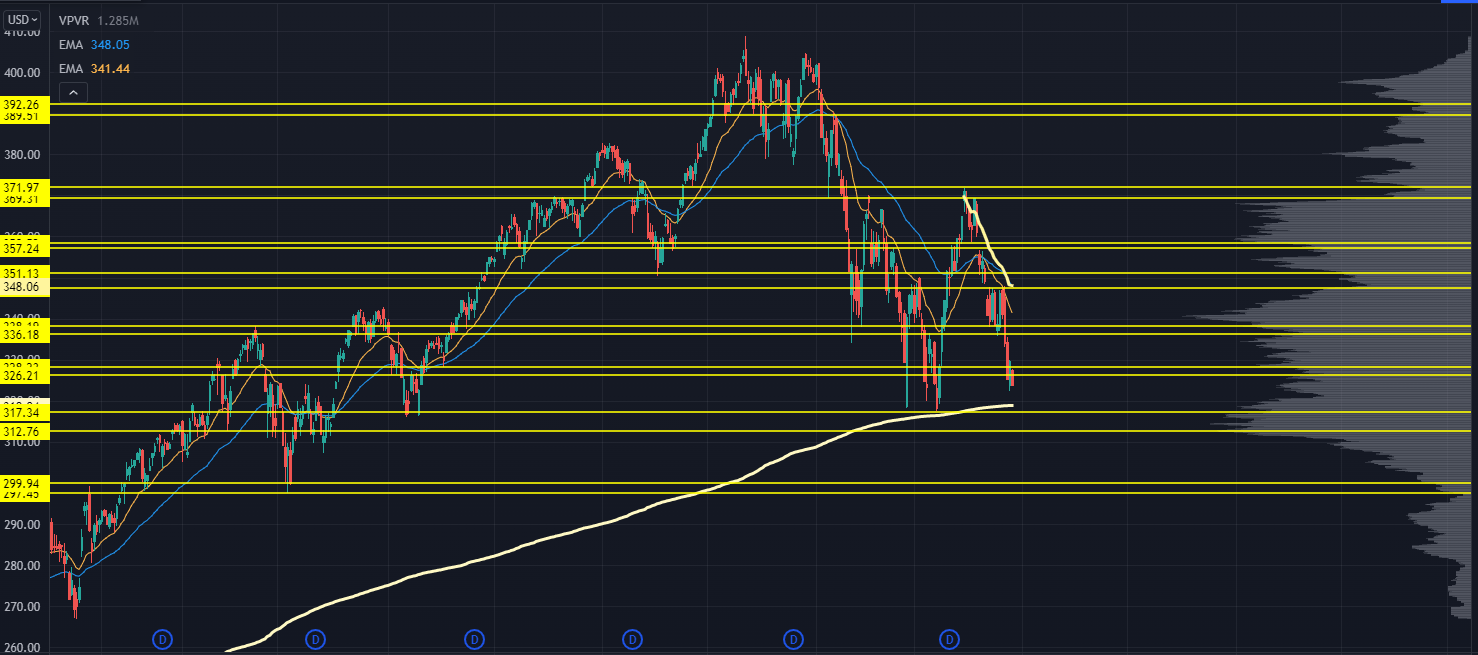
We could also see one more break underneath the Nasdaq’s recent lows to get that final flush for a good long-term buy signal:

NASDAQ Chart
(Check out this week’s Market Primer for a full explanation of the Nasdaq’s levels on this chart).
Now, there were times when this signal triggered, but the market didn't bottom for another week.
The worst case was the Great Financial Crisis — we got close to a 0% reading, and it took a few months for a proper market bottom.
But given the current market sentiment and how nobody wants to touch tech because of interest rate risk…
You should consider where you'd like to play tech stocks to the long side for a huge bounce.
The best way to do this is to arm yourself with our Trading Roadmap.
It points out all the key price/volume levels where buyers and sellers could flood into a name (the Nasdaq chart above is a great example of those levels.)
>>>Watch this special video to learn how to equip yourself with this Trading Roadmap.
Original Post Can be Found Here