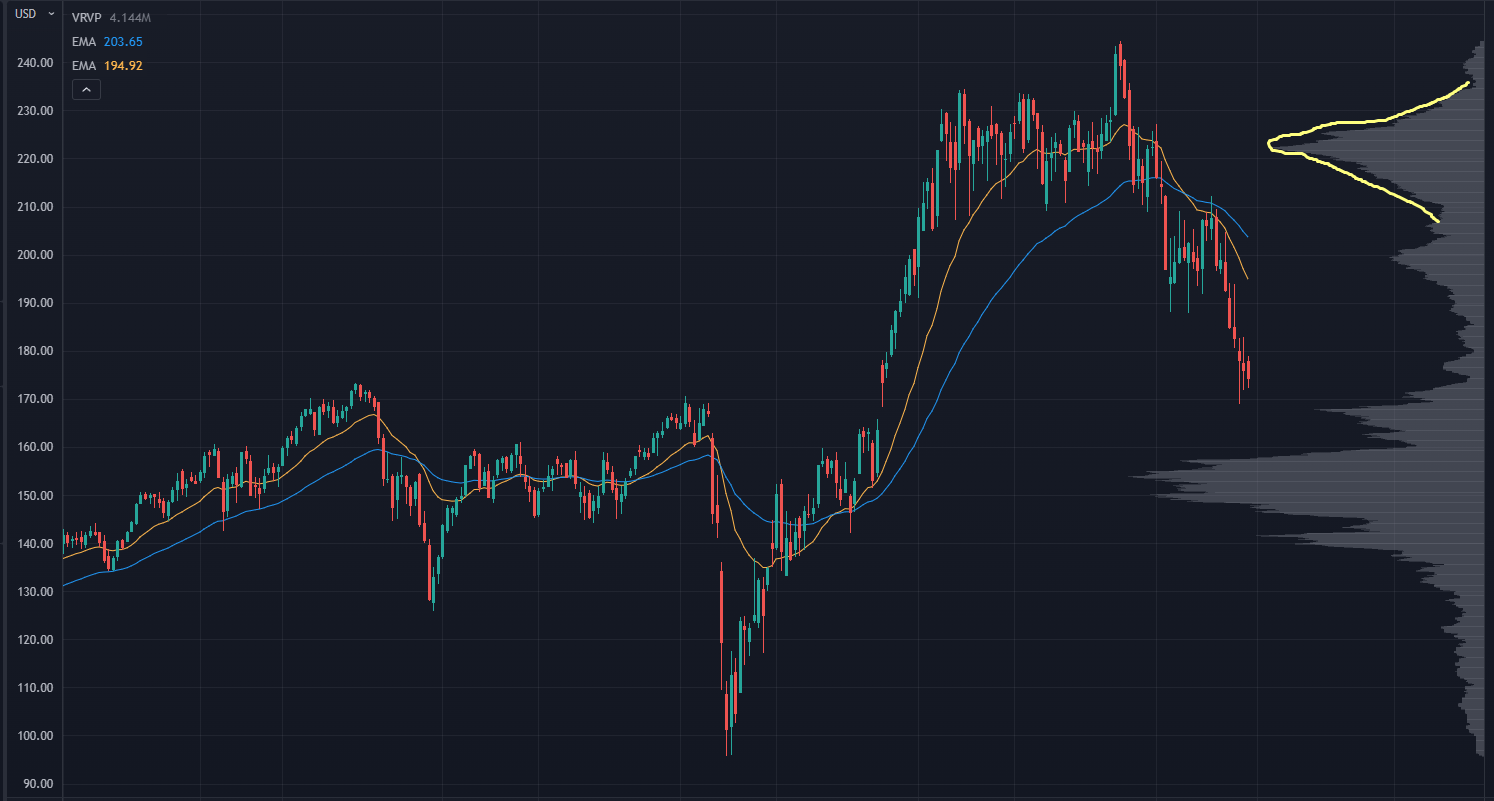
In a normal market, our Trading Roadmap looks something like this:

Chart Highlighting Volume Indicator
That highlighted portion is a key high volume node (HVN), and the volume is “stacked” in a way that resembles a bell curve.
Now, when one (or both) sides of the volume distribution drops off massively, we have what’s called a “volume shelf.”
These levels can be HUGE turning points in individual stocks.
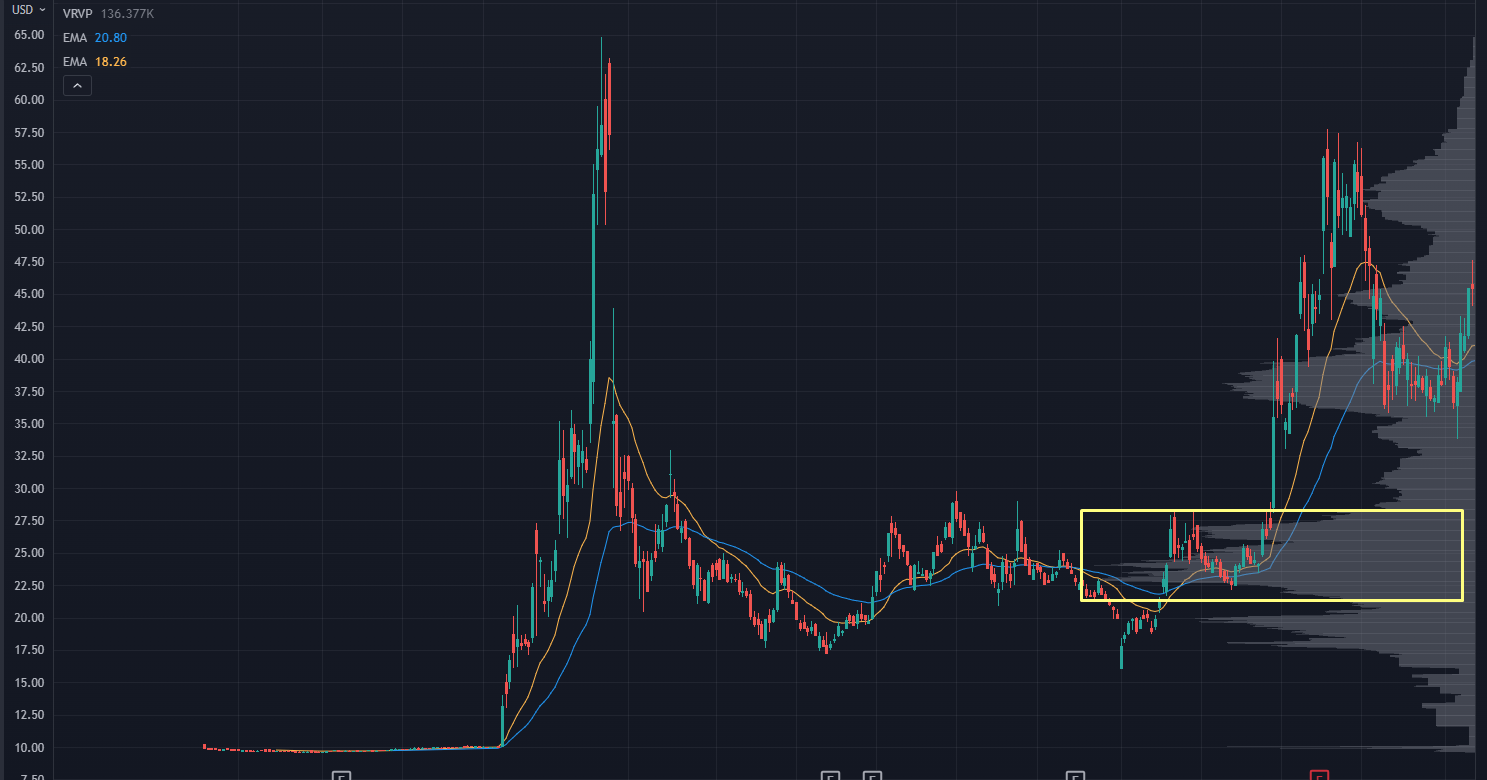
Let’s look at Lucid Motors (LCID) as an example:

LCID Chart
Look at the yellow box. The stock had just finished testing the recent highs, and then sellers pushed the stock back into the lower end of the range.
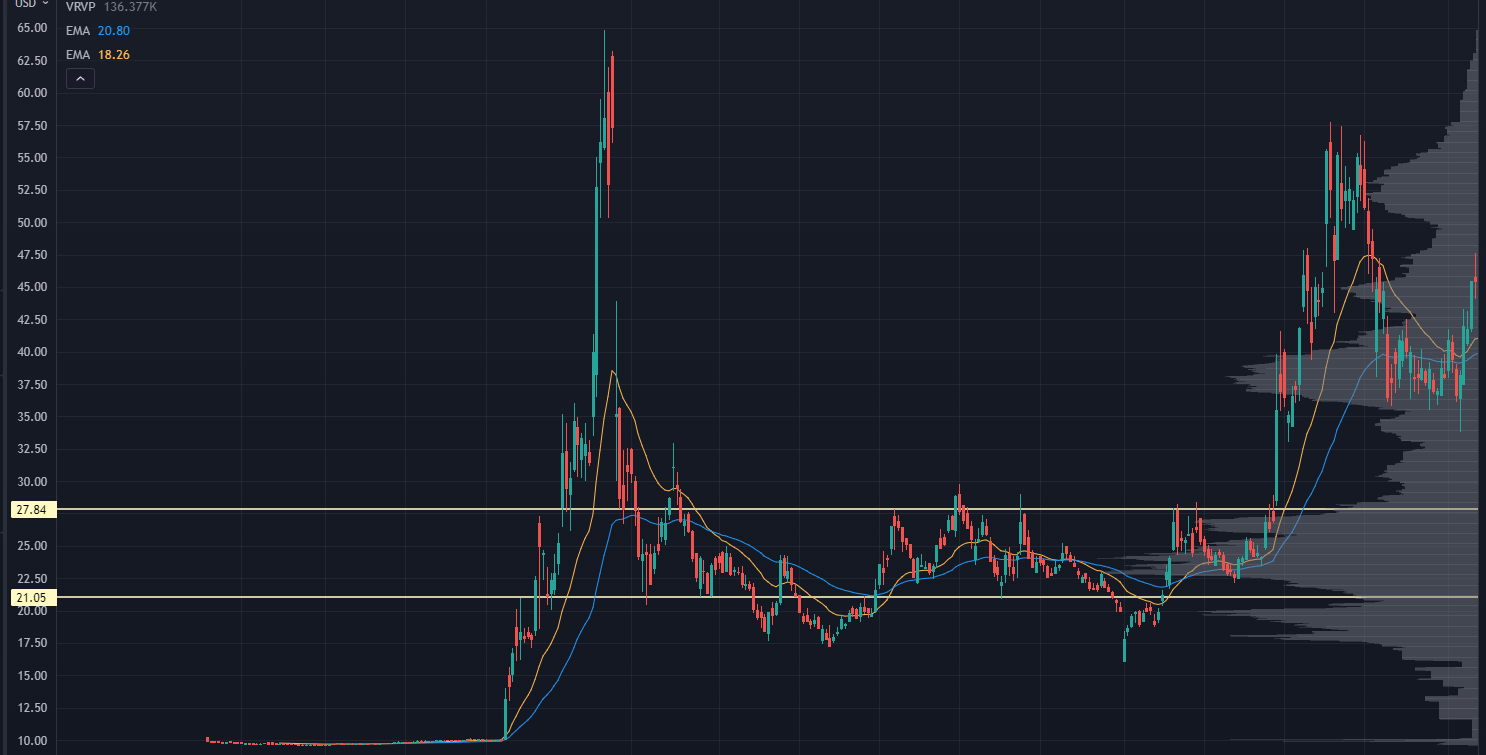
Now, let’s add some lines at the upper end of that box, which is the volume shelf, and the lower end, which is a key low volume node (LVN):

LVN Chart
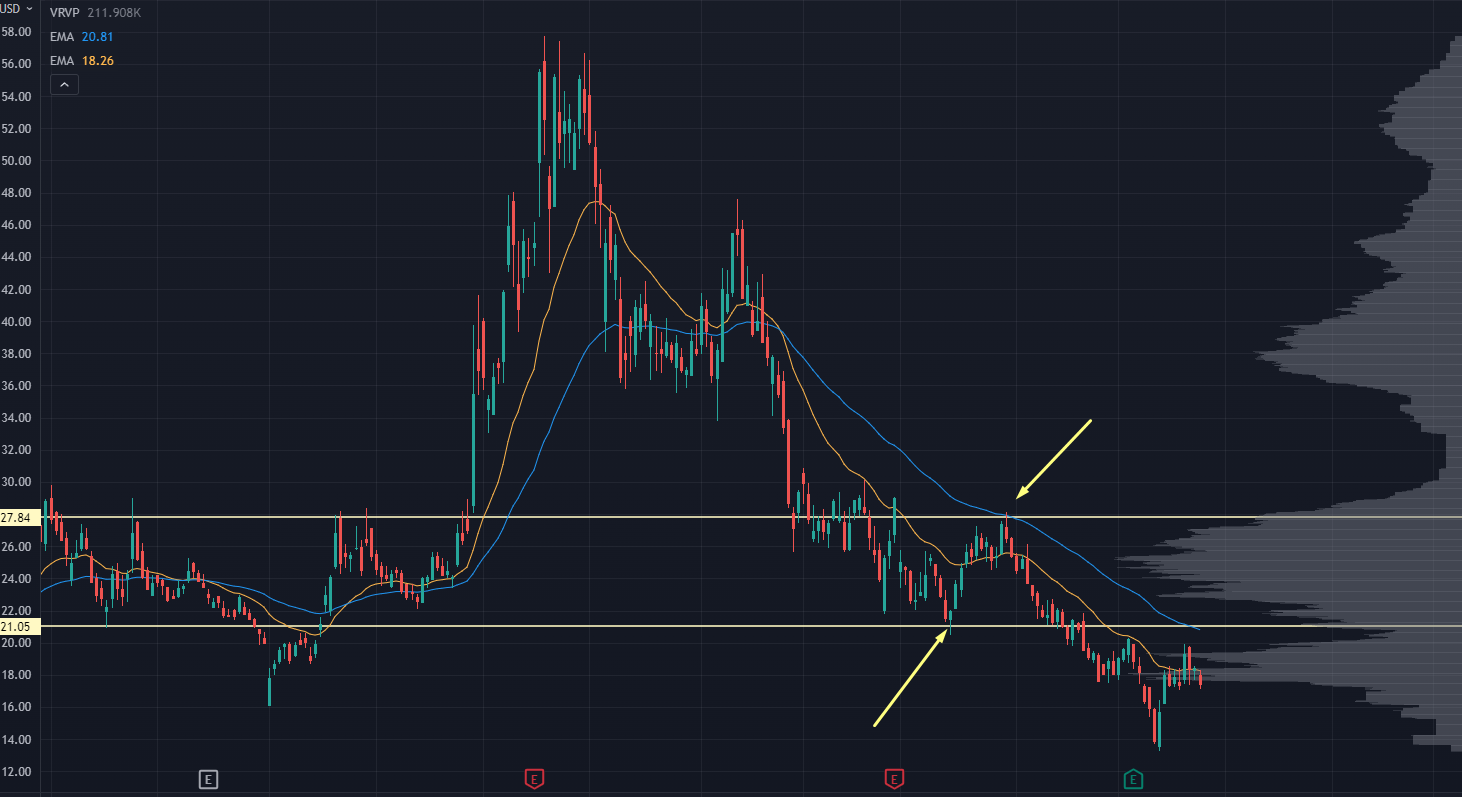
Fast forward to where we are trading now:

LVN Chart Now
Could you have taken the long position at the lower end of this range? Sure.
But we know that sellers would most likely come in as we headed towards that volume shelf.
It also lined up with the 50 EMA, so the evidence was stacked further in favor of the short side.
Now, volume shelves are just one feature of our Roadmap. I already alluded to a few more in this article.
If you want an in-depth training on the Roadmap, check out this free training webinar.
Original Post Can be Found Here