I have a very robust network of investors and traders I talk to…
And everyone’s minds’ are stuck on the same topic:
Whether or not the Fed’s stuck on the wrong foot.
Here’s the basic idea:
After 2020’s bear market, we saw a global fiscal and monetary response unprecedented in modern markets.
Even though the "experts" were telling us inflation was “transitory”…
We knew better.
Then came November 2021, when Jerome Powell admitted inflation was a little stickier than anticipated…
And that they’d have to hike rates to contain it.
In a normal business cycle, inflation can help businesses for a little while. Consumer spending remains relatively stable, but prices increase, which means more revenues.
But then input prices start to change the company’s input costs too much, making products more expensive, which causes consumers to reduce their spending.
You then see deflationary signs at some point. This usually resets the entire thing.
Anyways, the markets are starting to show the same warning signs that have preceded recessions in the past.
Let’s look at each one.
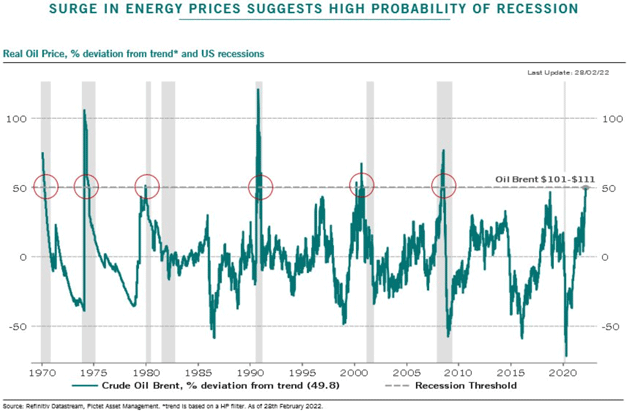
Here's a chart that made the rounds last week:

This shows us the "stretch" in oil prices away from the trend.
Monster moves higher in oil can create a price shock that makes its way through the markets. As it works through the economy, corporate profit margins shrink thanks to higher input costs and lower consumer spending.
As we discussed, this can lead to a recession.
Since 1970, there have been 6 oil price shocks. They have all preceded economic recessions.
Of course, it's possible that "this time is different."
So let's start looking at another indicator — this time, in the bond market.

The bond market’s starting to show signs of increasing recession expectations.
The theory is that when the yield curve goes negative, that means investors believe the short term is riskier than the long term, and so will move into longer-term bonds to protect falling equities if a recession were to happen.
Thus, we can measure recession expectations by comparing the yields on treasuries of different durations.
The "big kahuna" spread is the 10-year/2-year spread. However, that hasn't gone negative yet, so it's not a full-blown recessions signal.
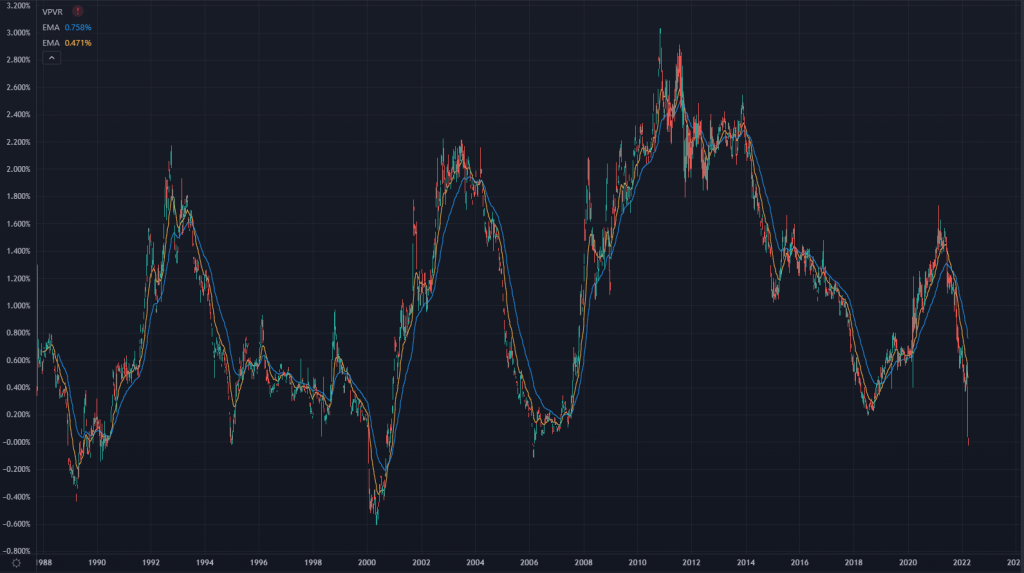
But there’s a second spread to look at — the 30 year/5 year spread…
And it just flipped negative for the first time since 2006.
Keep in mind that the stock market continued to rally from 2006 until about summer 2007, so the 30-year/5-year inversion is not an immediate signal.
We’ll be keeping a close eye on the 10-year/2-year curve to see if the market fully expects things to get weird in a year or two.
The most important thing to remember is that the stock market is not the economy.
Two things to keep in mind:
The market absolutely cratered in 2008, but the official "recession" side of things didn't take place until after that strong move.
And by the time we were officially in a recession, the markets had already bottomed.
Second: A recession doesn't mean the market has to collapse 50%.
Even though the Great Financial Crisis was 14 years ago (wow, does time fly!), we’re still absolutely anchored to that kind of expectation in bear markets.
A recession can mean a much smaller drop in the markets than you might expect, so don’t freak out.
That said, smart investors know that a market bottom could be an excellent buying opportunity. It could be a great way to scoop up stocks at a discount.
Let me show you how to find the best buying opportunities should a recession smack the stock market:
Just watch this free presentation.
Original Post Can be Found Here