

Every trader is focused on the US’s next inflation numbers.
Yes, it’s bad…
But it could be worse. Here’s a chart of dollar futures:
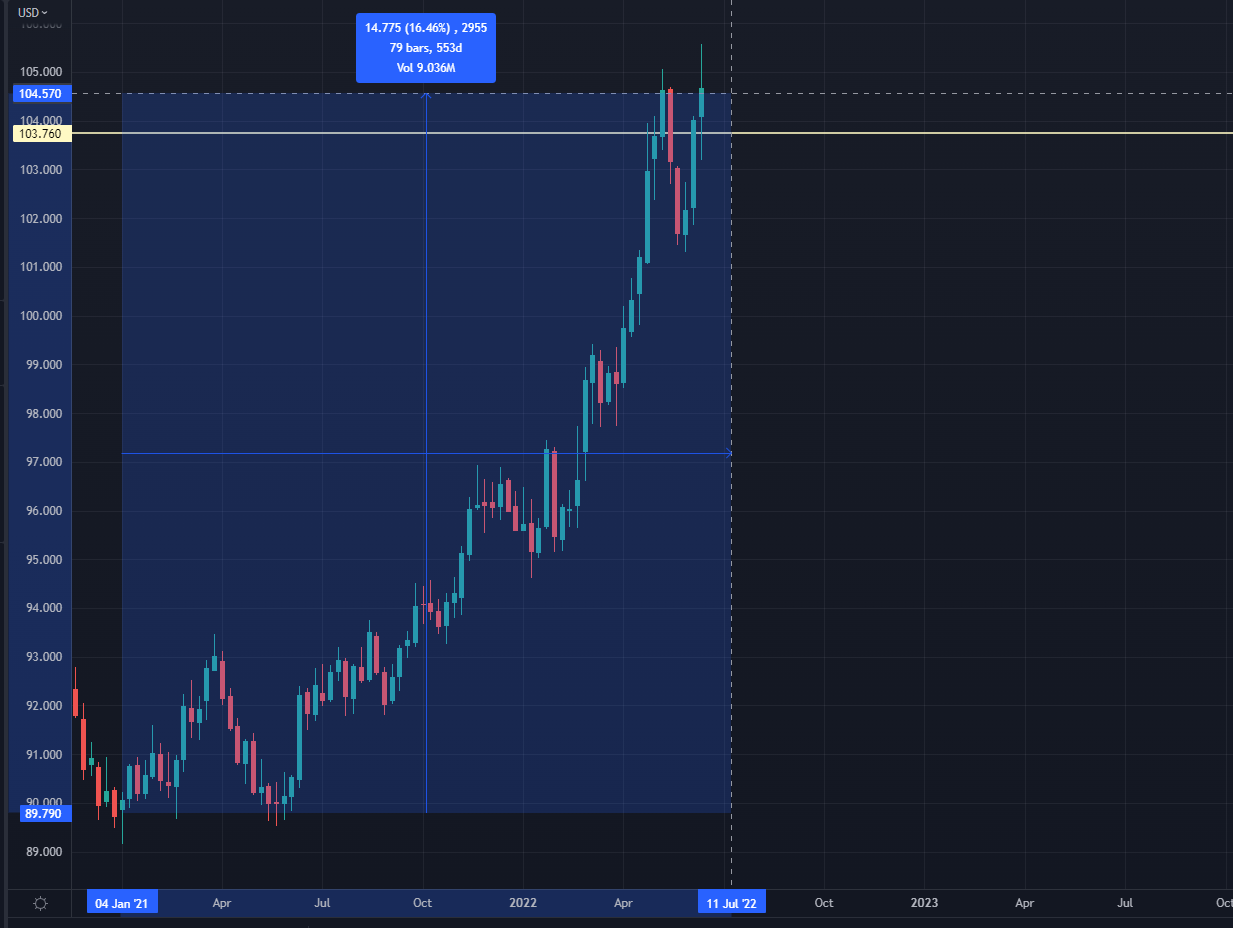
Dollar Futures
The dollar has rallied 16% year-to-date.
Right now, the dollar is the safe haven against much of the macro risk because inflation is high…
But it’s a lot worse in Europe because they are closer (geographically and otherwise) to the Russia-Ukraine war.
There’s one other source of instability in the dollar right now — how it’s trading against the Yen:
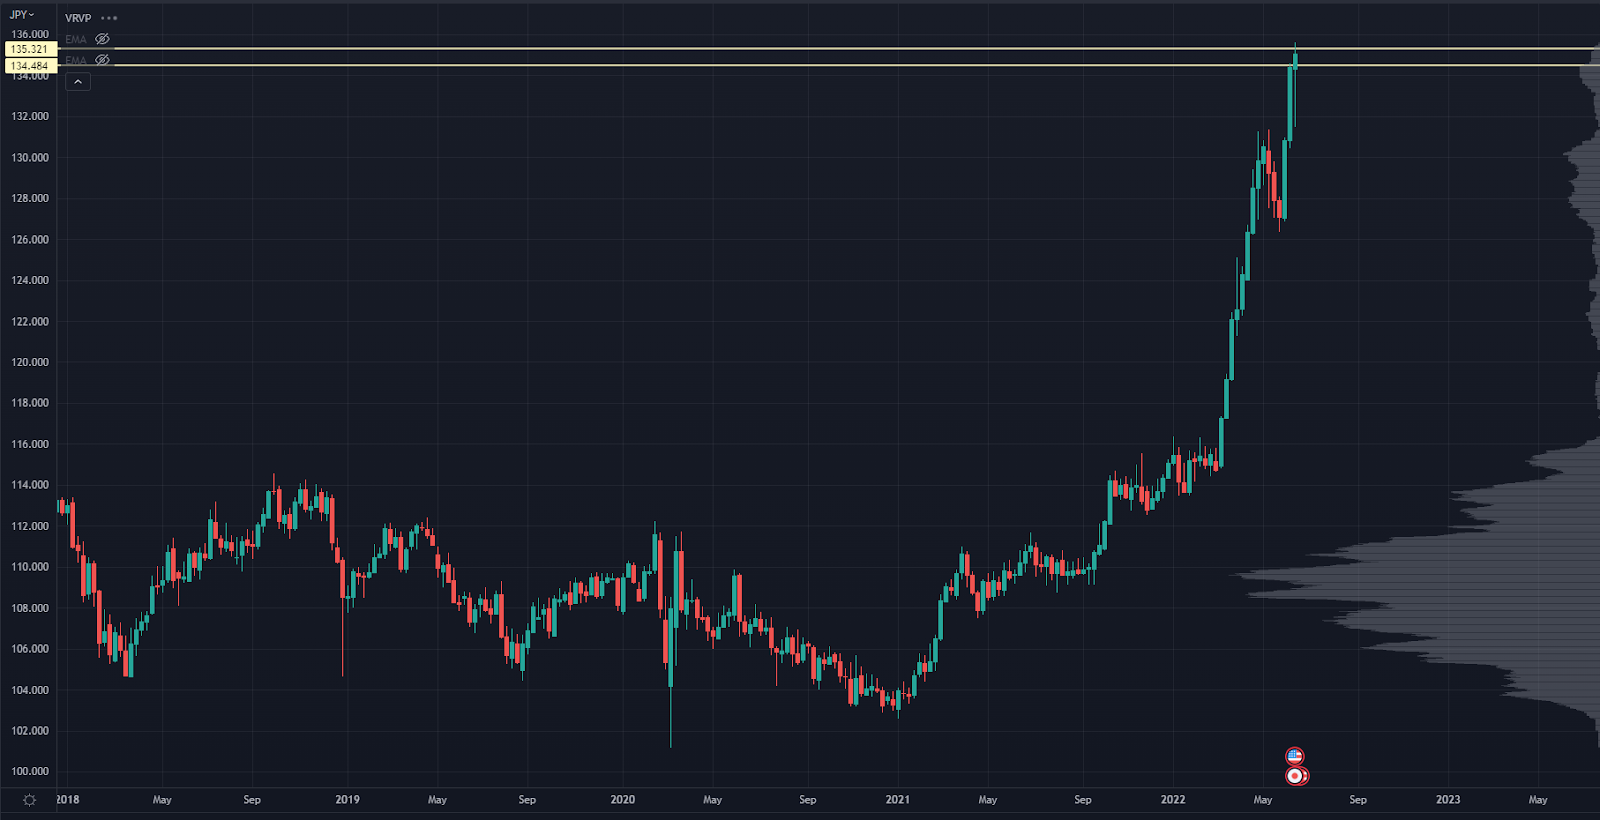
USD JPY Chart
What a move!
The dollar has been a “hockey stick” since breaking out of the multi-year value area.
When you zoom in to the past week’s trading action, you can see a hard move against the trend:
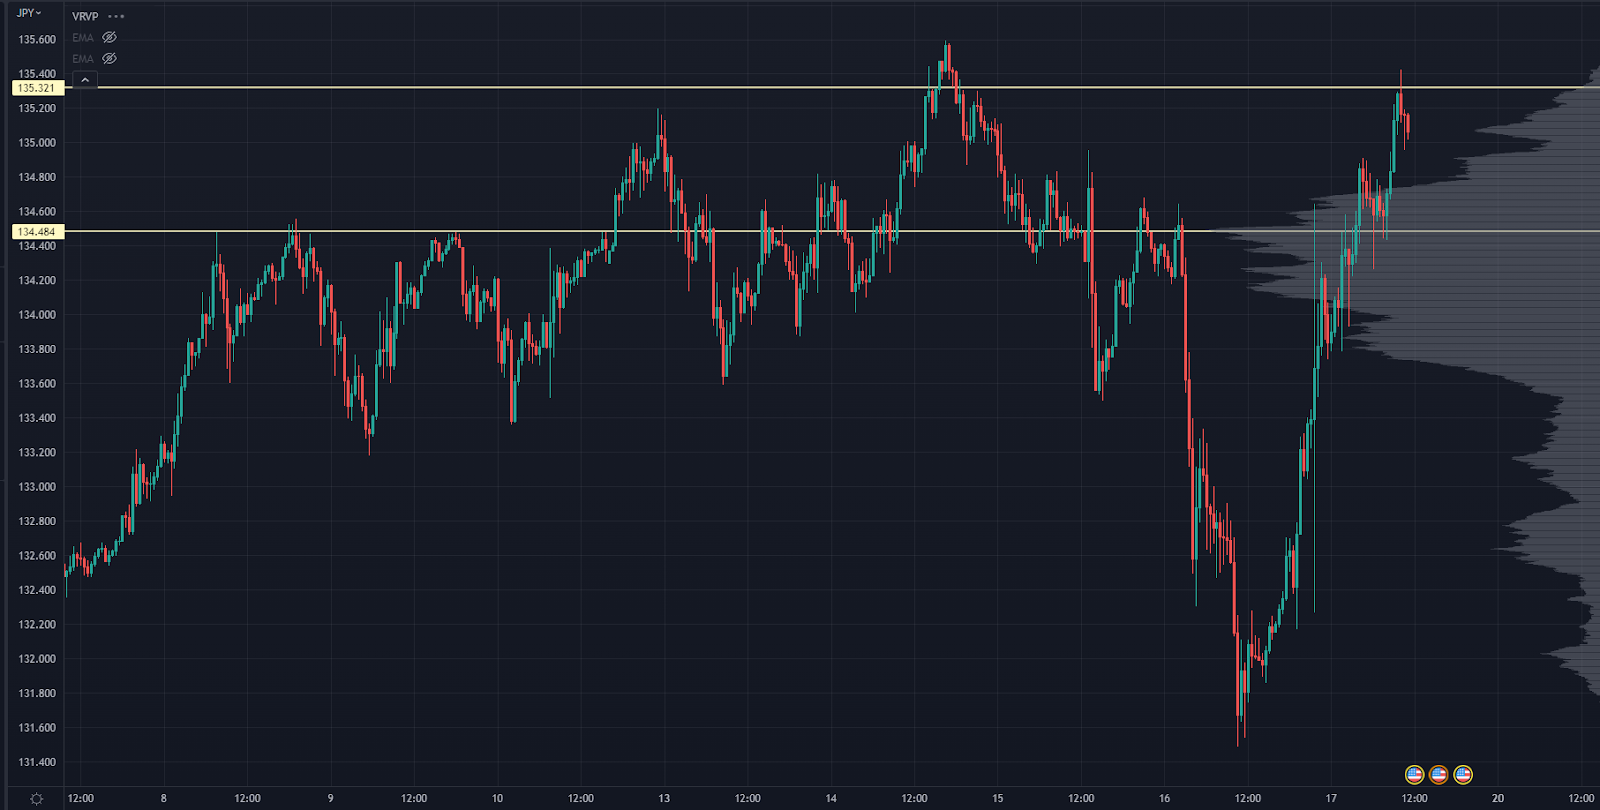
USD JPY Chart
Here’s the macro backdrop behind this, straight from the Bank of Japan:
“The experience so far with the negative interest rate policy, which was introduced in January 2016, shows that a combination of a negative interest rate on financial institutions' current account balances at the Bank and purchases of Japanese government bonds (JGBs) is effective for yield curve control.
In addition, the Bank has adopted the fixed-rate purchase operations and the fixed-rate purchase operations for consecutive days in order to achieve the smooth conduct of yield curve control.”
There’s a lot of nerd-speak here, but here’s the basic idea…
The BoJ wants to maintain a 2% inflation rate. To do that, it has to introduce negative interest rates and peg its 10-year bond at the 2% rate.
Here’s the yield on the Japanese 10-year bond:
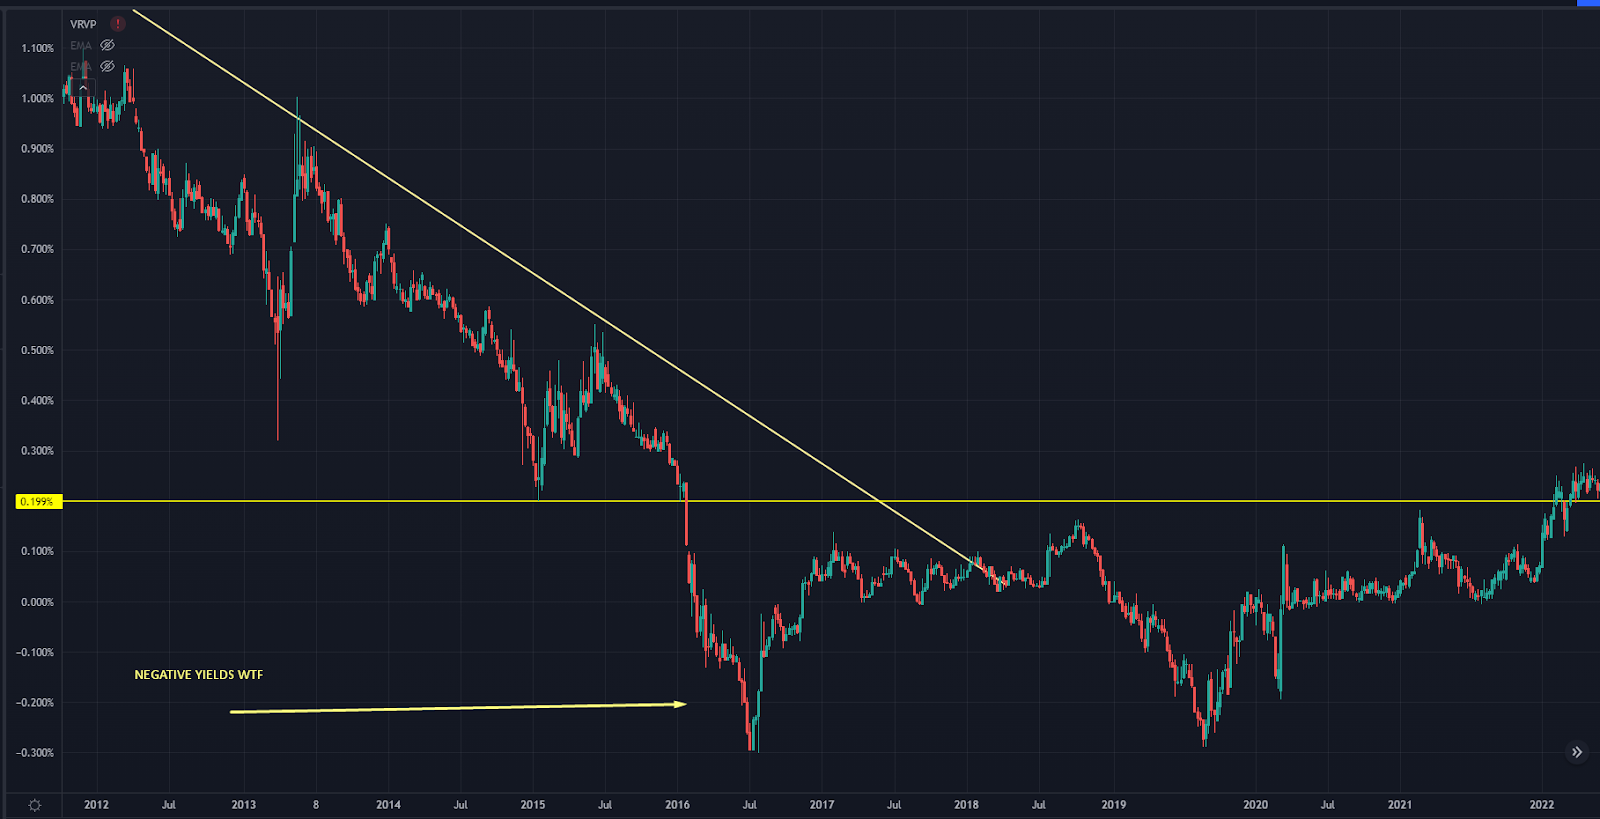
Bank of Japan Chart
Yes, those are negative yields. It’s absolutely bonkers.
Yields have crept up recently, and price was holding above the level they were trying to peg:
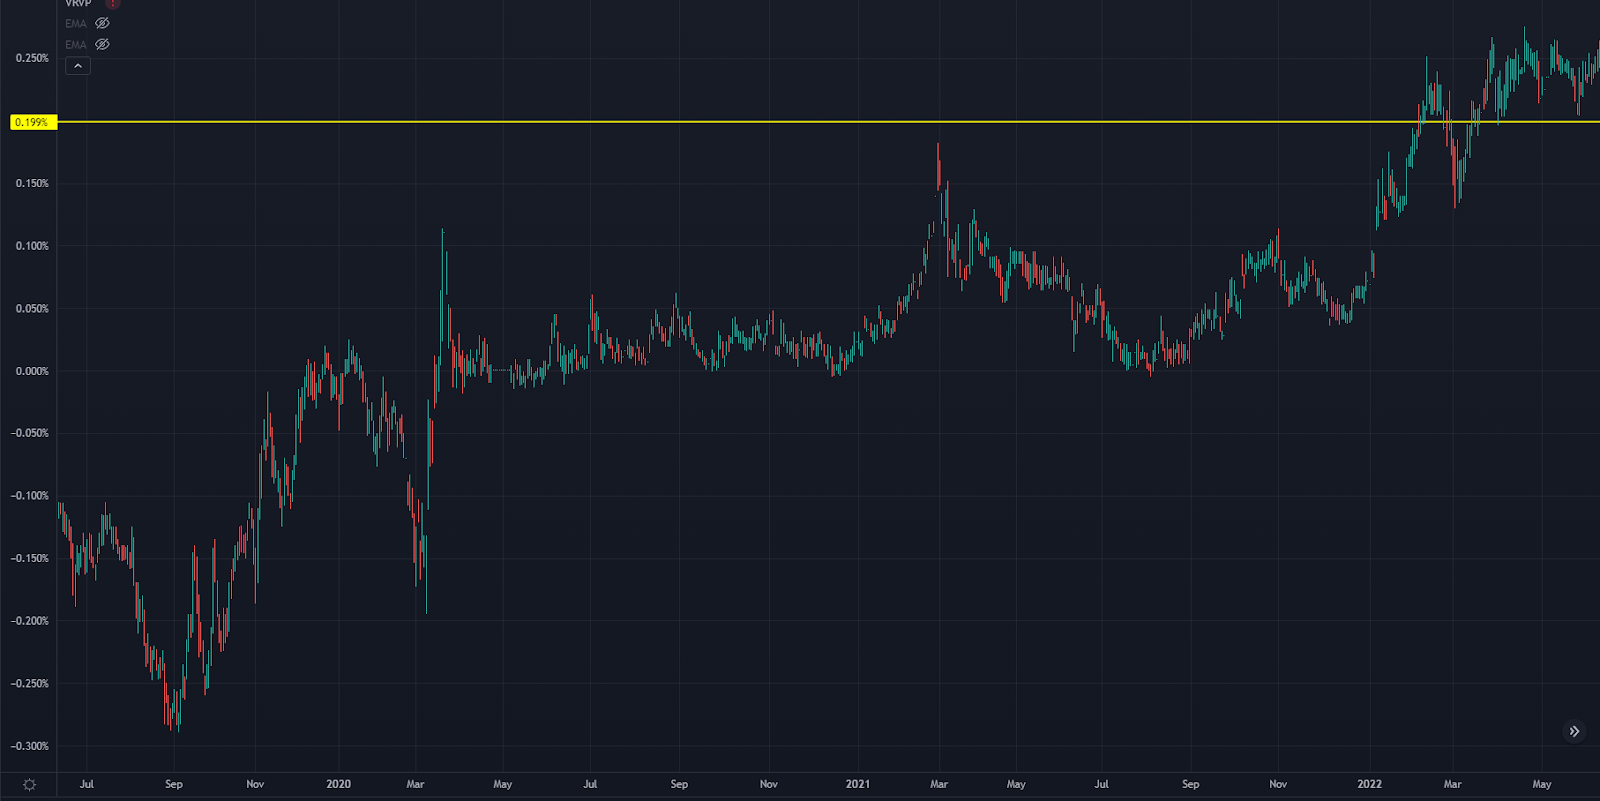
Bank of Japan Chart
I’m not an expert on the mechanics, but the idea is that the BoJ has to print yen to buy these bonds, keeping yields down.
It was working… until last week:
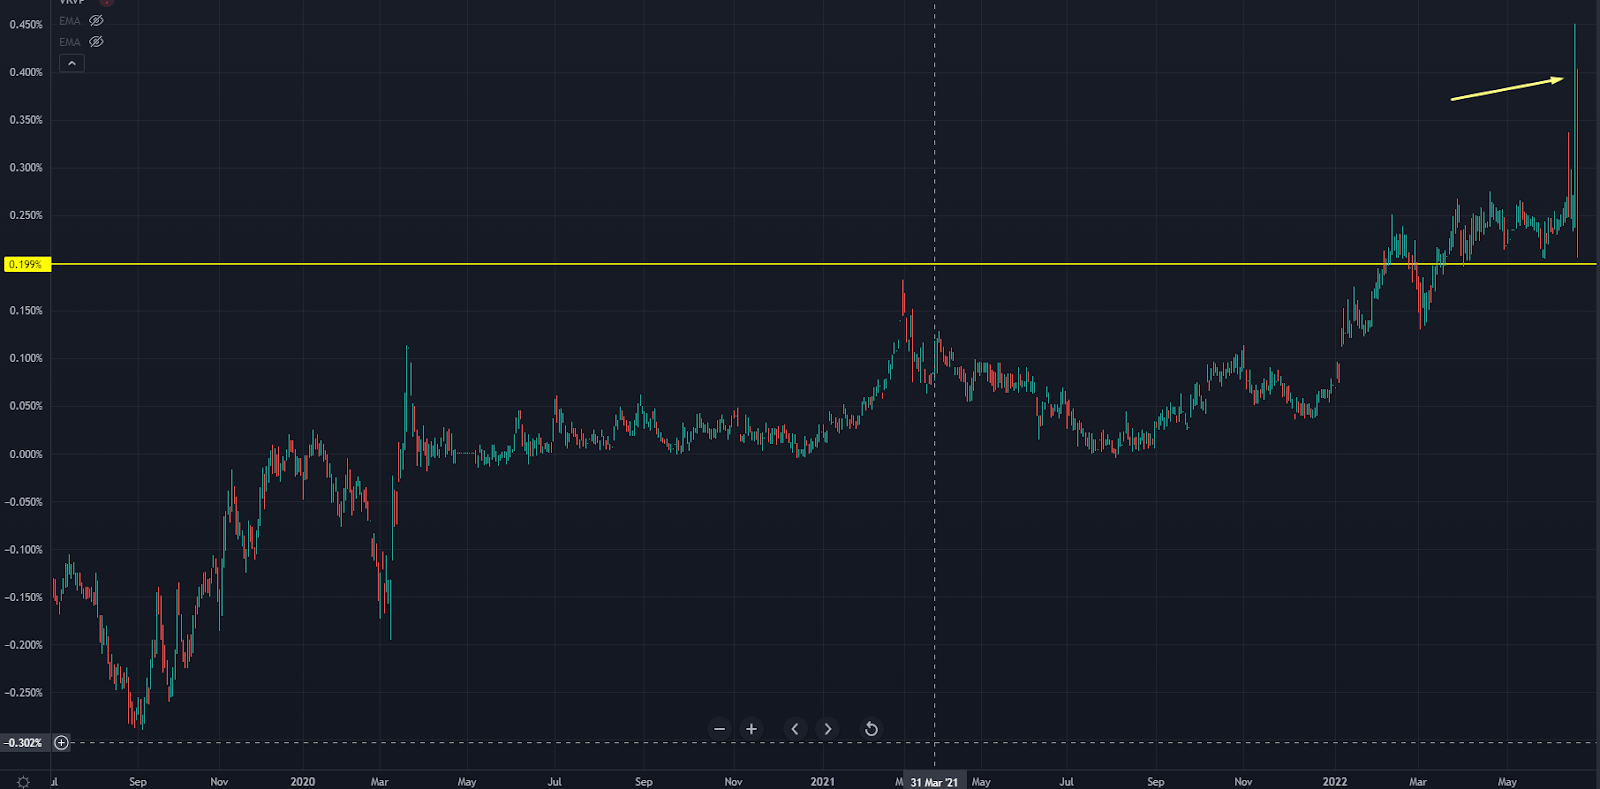
Bank of Japan Chart
Because the Yen depreciated so much against the dollar, the BoJ is stuck between making Japanese consumers pay higher prices on imported goods or keeping the yield lower.
That’s how the Yen broke hard…
And it’s how Precision Volume Alerts members made a quick double on FXY calls:
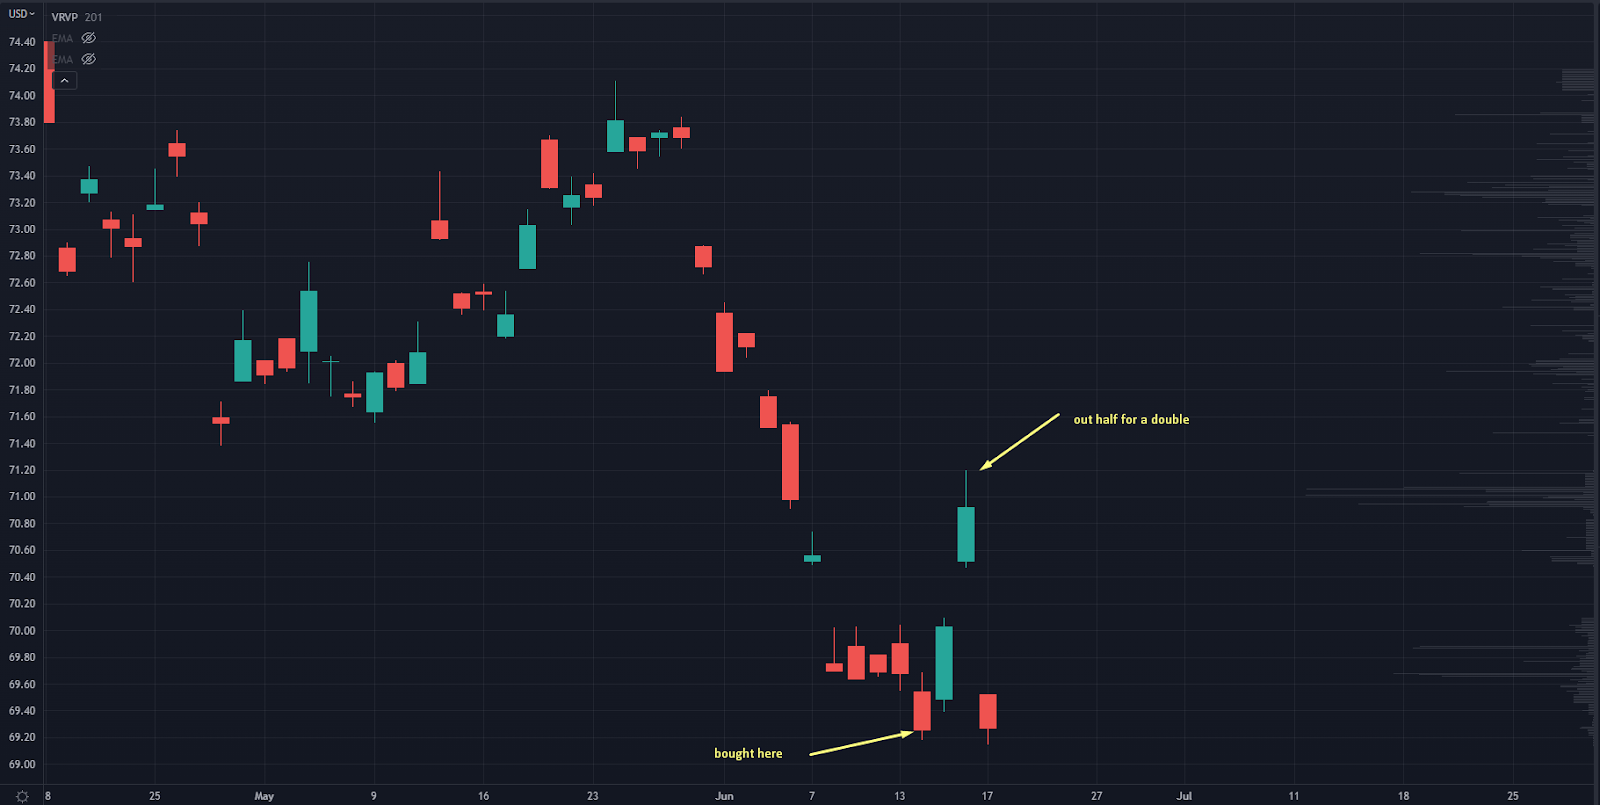
FXY Chart
Does this mean we are experts in macro stuff?
Nope — it’s because our Market Roadmap found levels on a very long-term USD/JPY chart:
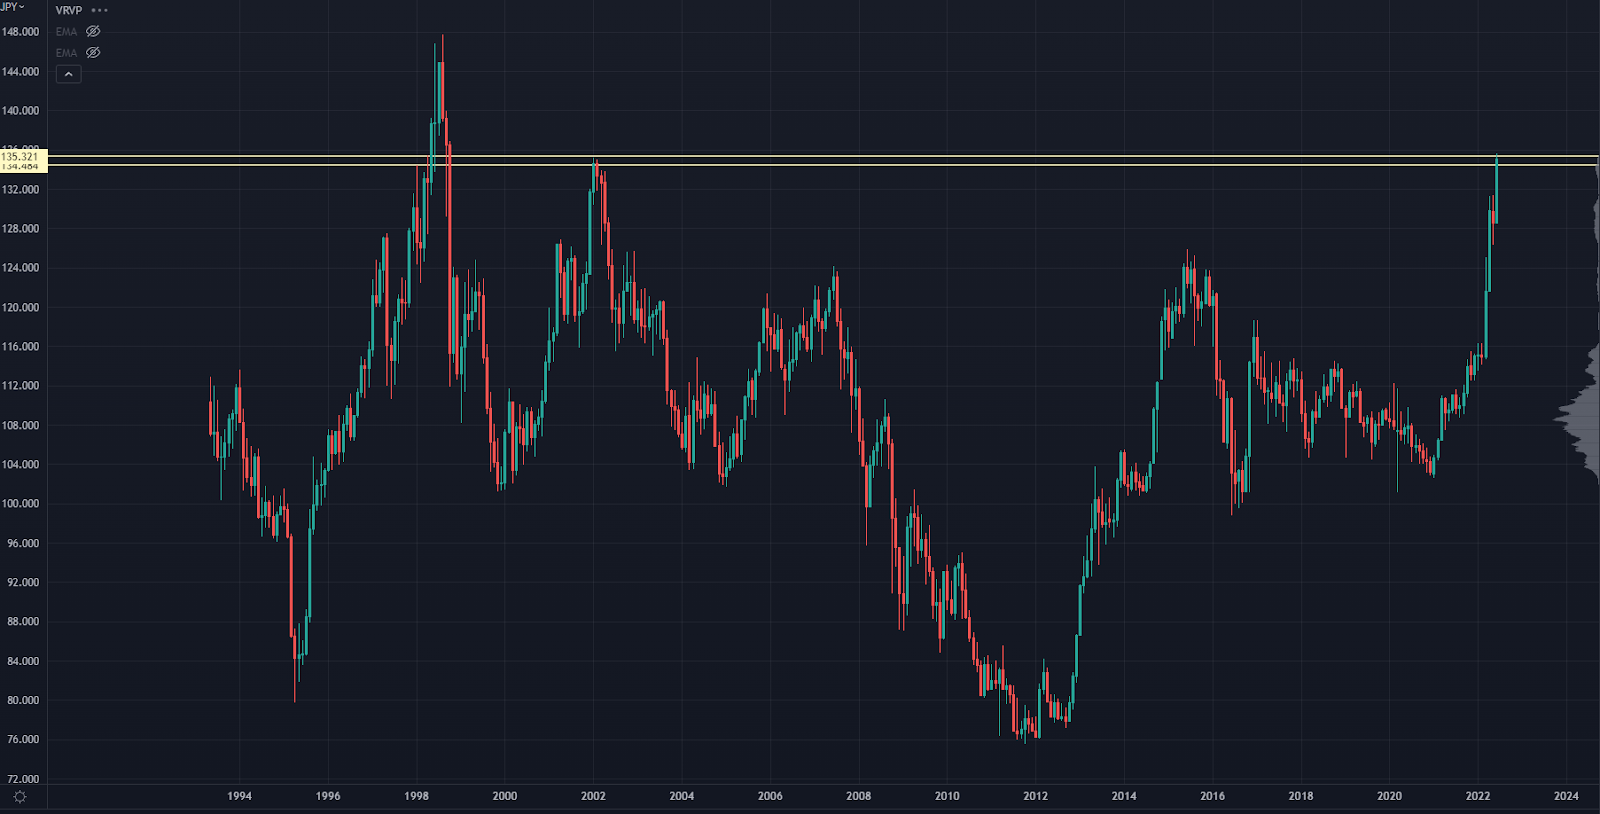
USD JPY Chart
Now that we’ve taken half off at a double, we have a risk-free trade looking for hard reversion.
The Bank of Japan may make significant policy changes since it must respond to the Fed’s aggressiveness.
That makes for a great contrarian case on the yen.
If you want to take advantage of moves like this one in the future… I’d recommend you equip yourself with our Market Roadmap.
Original Post Can be Found Here