


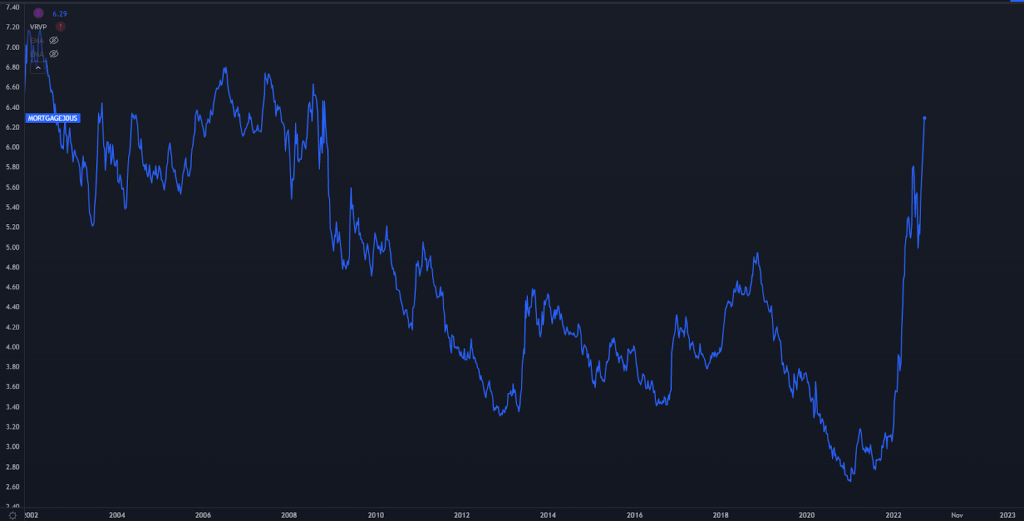
What you’re looking at is a chart of 30-year fixed mortgage rates.
Once inflation popped it’s head above the surface, we saw these rates go full “hockey stick” for the first time since the Great Financial Crisis.
With this big move in rates, REITs got kneecapped along with the rest of the market.
After all, if you’ve got an uneasy feeling about the property market, you can always just pick up some US Treasuries for yield.
But, we’re starting to see signs that REITs are offering an attractive opportunity.
Here’s an example of a small REIT that operates mall properties offering a 7.6% yield.
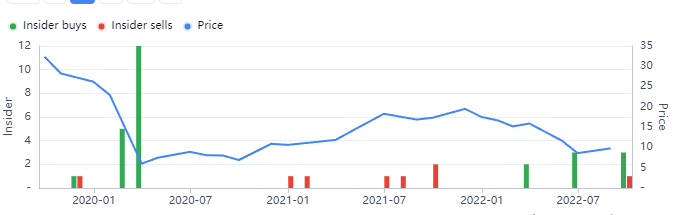
After seeing some monster trades back in 2020, the stock is closing in on the same level… so we’re starting to see buyers picking up size again.
We’re seeing more and more REIT names showing up with insider buying.
They might be expecting rates to cool off… in which case 8% yield will look pretty juicy.
It seems like a decent bet to me… but of course, there are a few potholes to avoid if you want to follow this Yellowbrick Road.
Interested to know what they are?
>>> Watch This Training To Discover Where Insiders Are Parking Cash In This Environment
Original Post Can be Found Here