After the HKD debacle I think we broke some liquidity structures in speculative stocks.
It looks like there’s not enough “milkshake” for everyone to drink so it’s turned into a giant fight over the straw.
It’s led to some strong runs…and it’s bleeding over into Meme Stocks once again.
But I for one am not a fan of the names that are on the move from this fiasco…
They carry too much volatility and built-in risk of getting run over… both to the upside and to the downside.
However, that doesn’t mean there aren’t some profit rich “hot zones” where you can trade these suckers and fill your account.
We’ve talked about the “Get Me Back At Breakeven Trade”.
This happens all the time in meme stock land.
Imagine that you are a married engineer that got caught up in the hype in 2021 and bet way too much money inside of AMC.
If the market moves back anywhere near “the land of breakeven,” you’ll jump on it like Joe Biden on 3 scoops of chocolate, chocolate chip…
Especially if your wife threatened divorce after you YOLOed the kids college fund in a stock that was already 300% up on the year.
Now, most of those who are just waiting on breakeven are “investors” who piled in on the same day…
A surge in volume and price creates a buzzing hornet’s nest in all these degenerate Reddit groups and the gambling addicts can’t wait to get in on the action…
… just in time for them to lose their shirts.
This is when we want to look at a single day’s VWAP.
Let’s use AMC as an example…
During its run in May of 2021, the largest volume was on June 2nd:
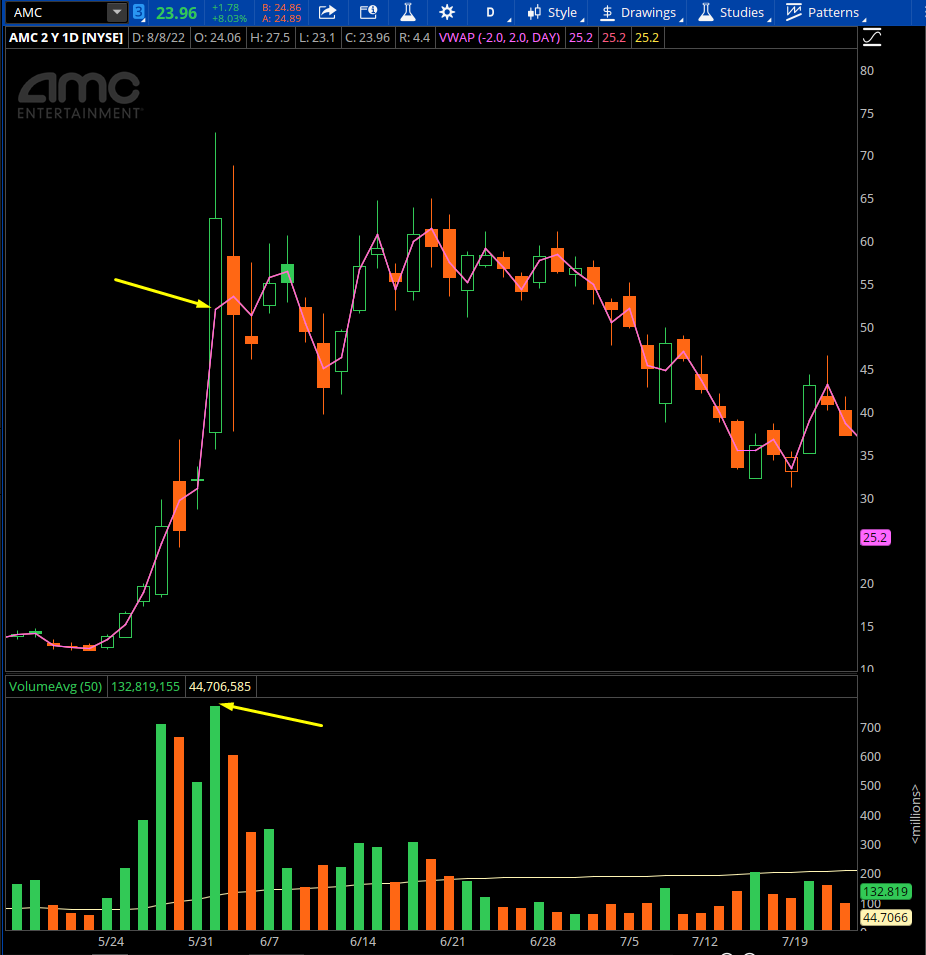
AMC Chart June 2nd Volume
If you draw a line for that single day’s VWAP, you can see the price interactions it had with it before it rolled over:
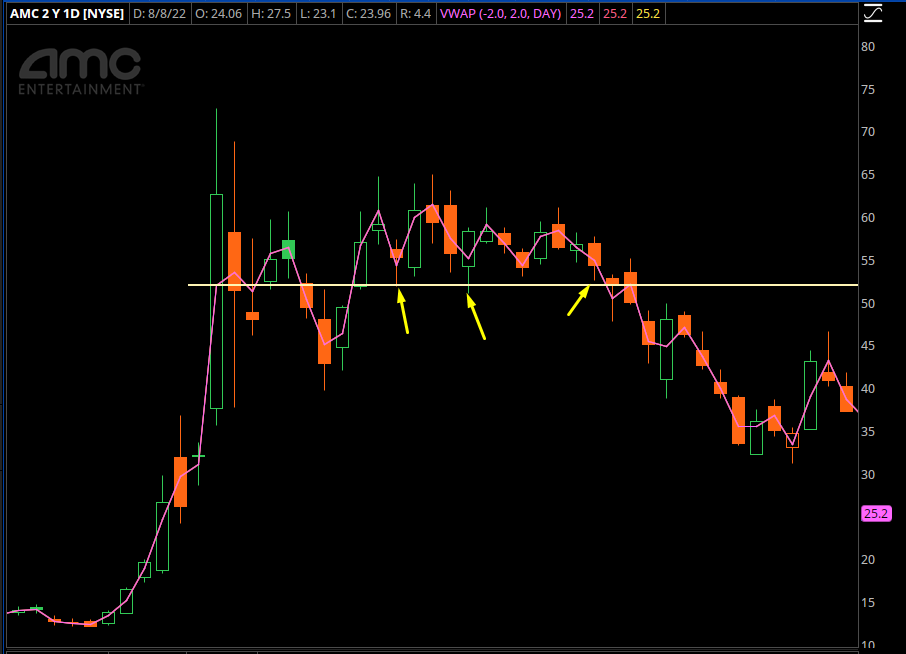
AMC Chart Price Interactions
Pretty cool right?
What about where the bounce ended in August?
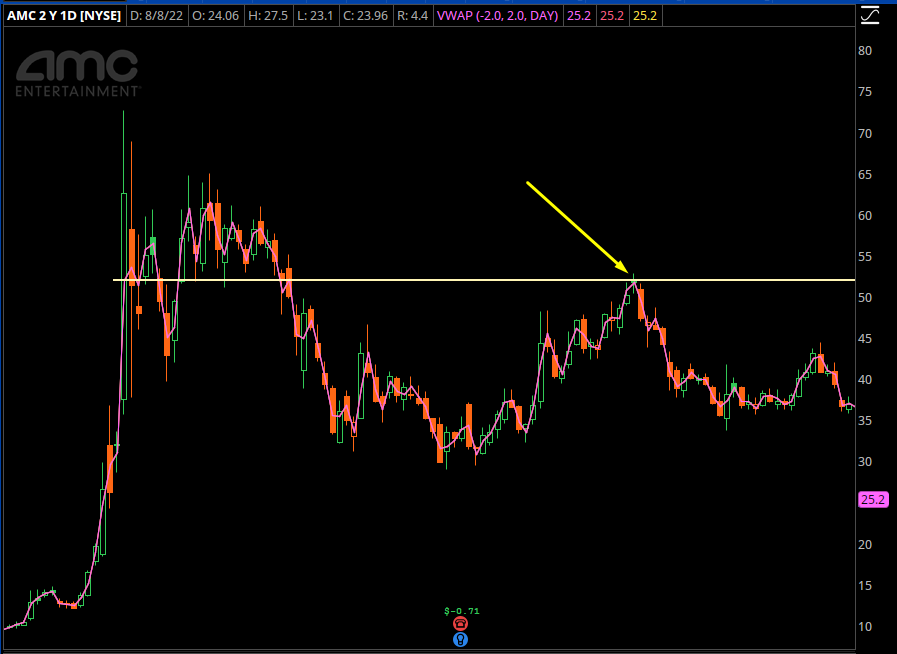
AMC Chart August Bounce
Imagine knowing about the hidden inventory at that level.
So right now, the stock is up 67% in a few days, and almost a double from the highs:
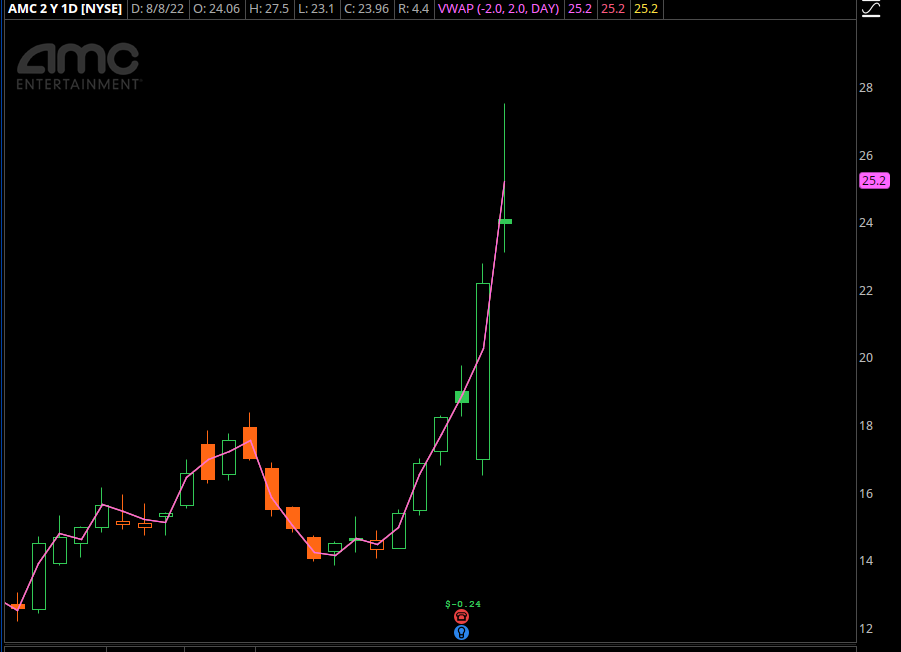
AMC Chart High
That looks like a pretty hard rejection at the highs, right? Where did that high come into play?
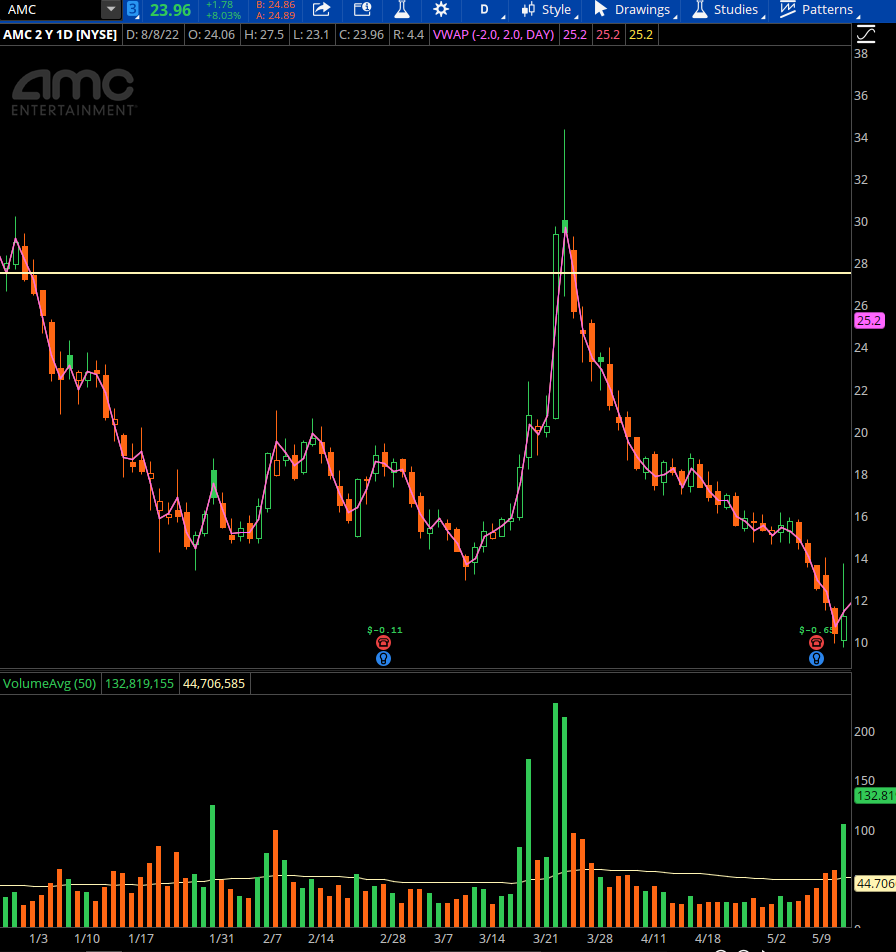
AMC Chart
That looks great, but it’s not totally precise is it?
This is where it gets wild, and this is some black magic that you’ve never seen on the retail trading side.
You’ve got two back-to-back volume spikes.
What if we take each day’s VWAP, combine it with the day’s volume, and look at a weighted average?
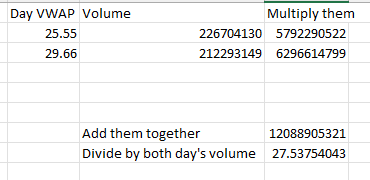
VWAP Math
It takes some basic arithmetic to get us 3 cents within today’s high.
>>> This Is The Roadmap That Shows You The Way
Original Post Can be Found Here