Stock Roadmap Signals Turning Point
We could be reaching a major turning point in the markets.
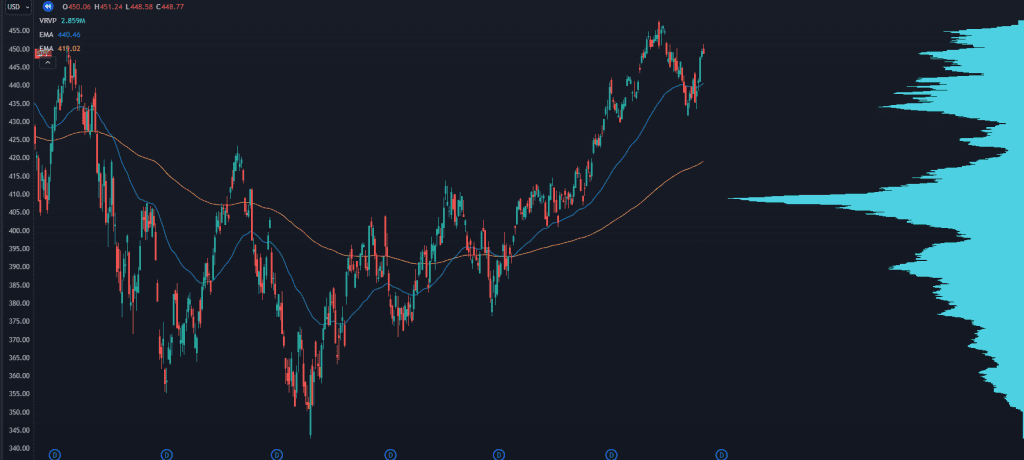
The chart above shows where price finished at the beginning of September. There had been signs of weakness in the market and there was a dip.
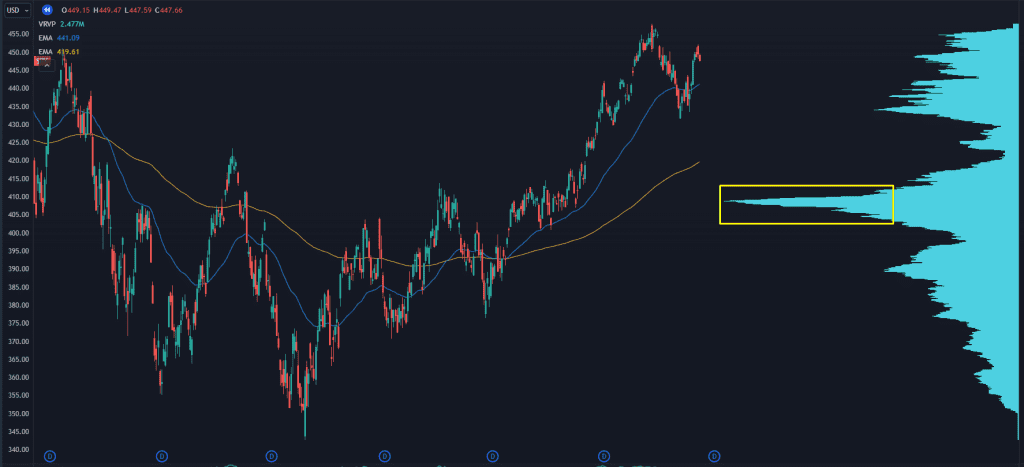
Can you spot the target on this chart?
The giant “magnetic” level where price just wants to return?

Stock Roadmap Signals Turning Point
This is where most of the trading volume is on the S&P 500. It’s the point where most institutions traded the index, and where they’d be very interested if the market pulled back into.
That’s why for the past two months I haven’t tried to be aggressive on the long side. Sure we’ve had some nice trades with indices – we pulled out 90% on some SPY calls – but I knew that this was the “big kahuna” level for the market.
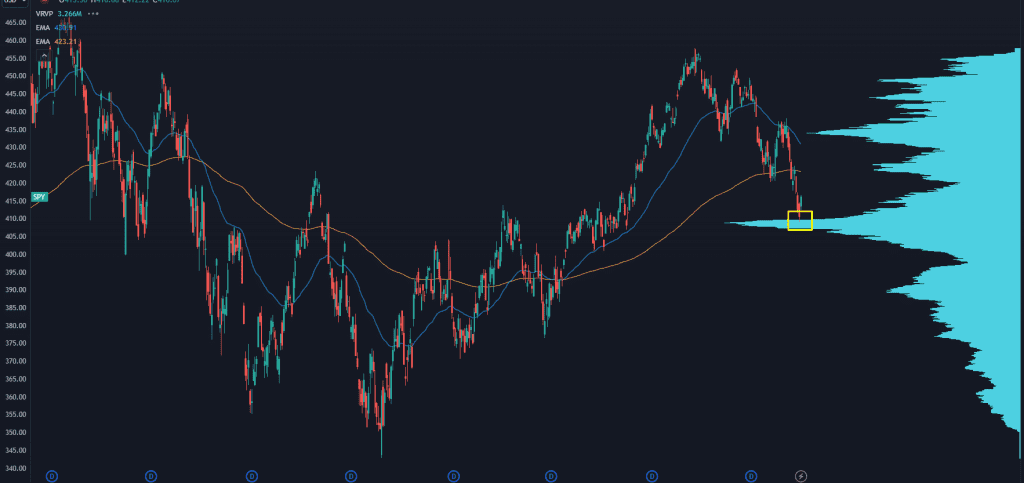
Fast forward to today, and where do we sit?

Stock Roadmap Signals Turning Point
A perfect, to-the-tick bounce off that level. It looks like some institutions are willing to play ball into those levels.
We could see one more push lower to clear out earlier dip buyers, but if this area continues to hold then you can throw all the headlines away…
We are going higher. And we’re going to use this roadmap to guide our profit opportunities along the way.
If you’d like to learn more about how this stock roadmap works – including how we’ve used it to find setups through every market twist and turn since Covid…
Click here and I’ll walk you through the whole thing step by step.
Original Post Can be Found Here