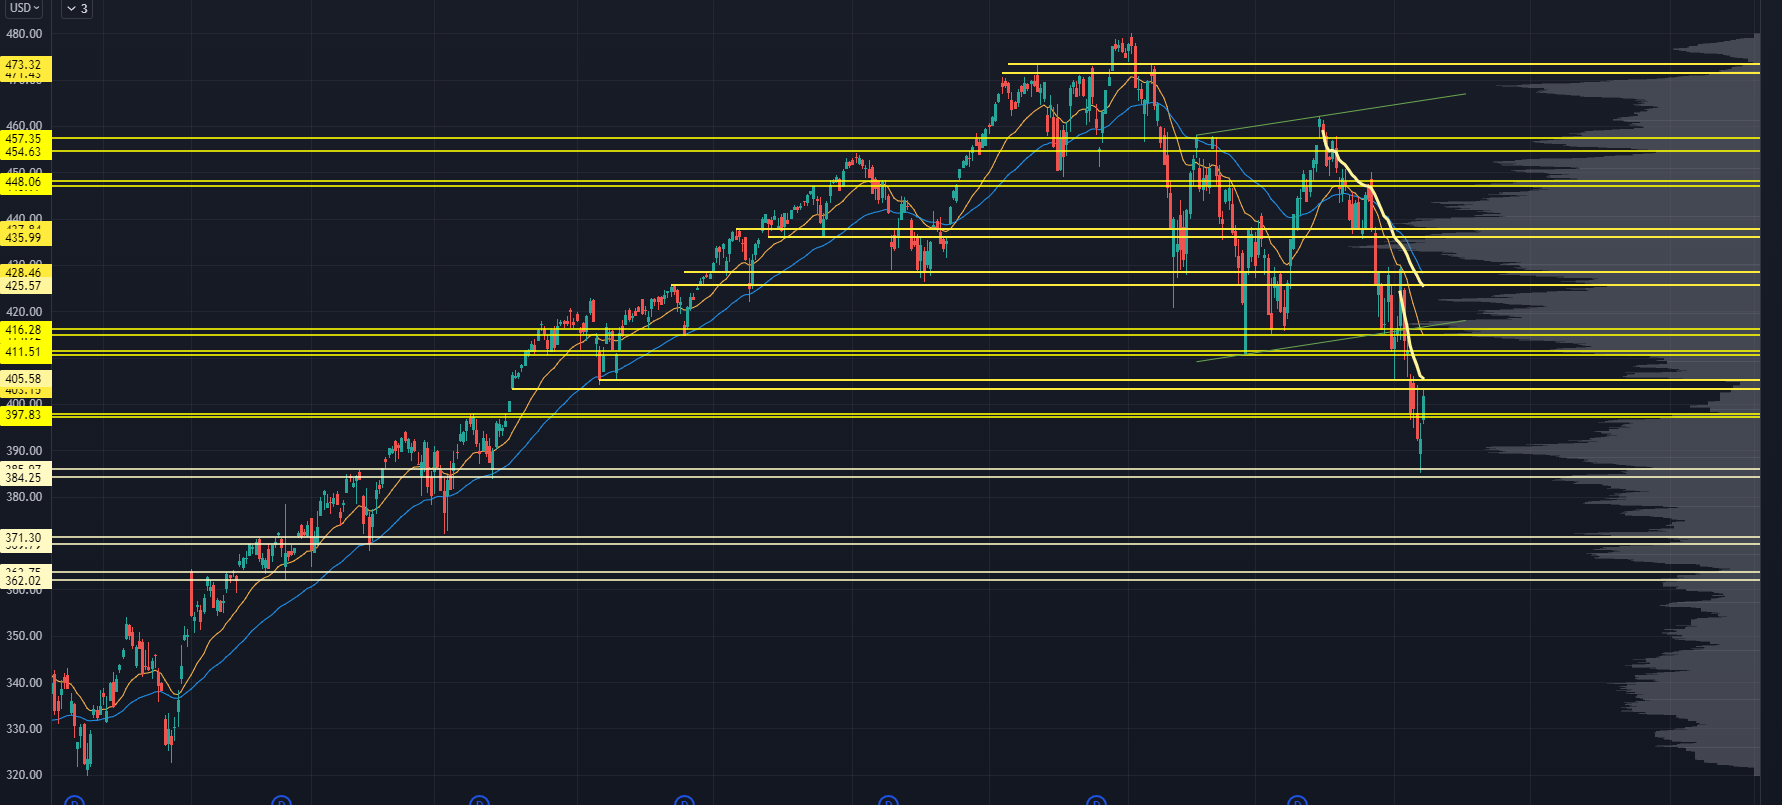
SPY Chart
Before last week, the market was in a high-volatility chop-fest and held both sides of the range very well.
Once we took out 405, we saw a fast move to the 397 level I focused on for a while.
I thought it would be a decent level for buyers to come in, but when forced liquidations are involved, liquidity demand can easily cause overshoots.
The next key level is down at 385.
I didn't have that level marked last week, but don't mistake this for some "hindsight" level — it’s precisely where a key low volume node (LVN) resides.
We’ve seen a very aggressive price response at that level, and now, many traders are asking, "Was that it?"
We did see multiple assets come into massive levels on multiple timeframes.
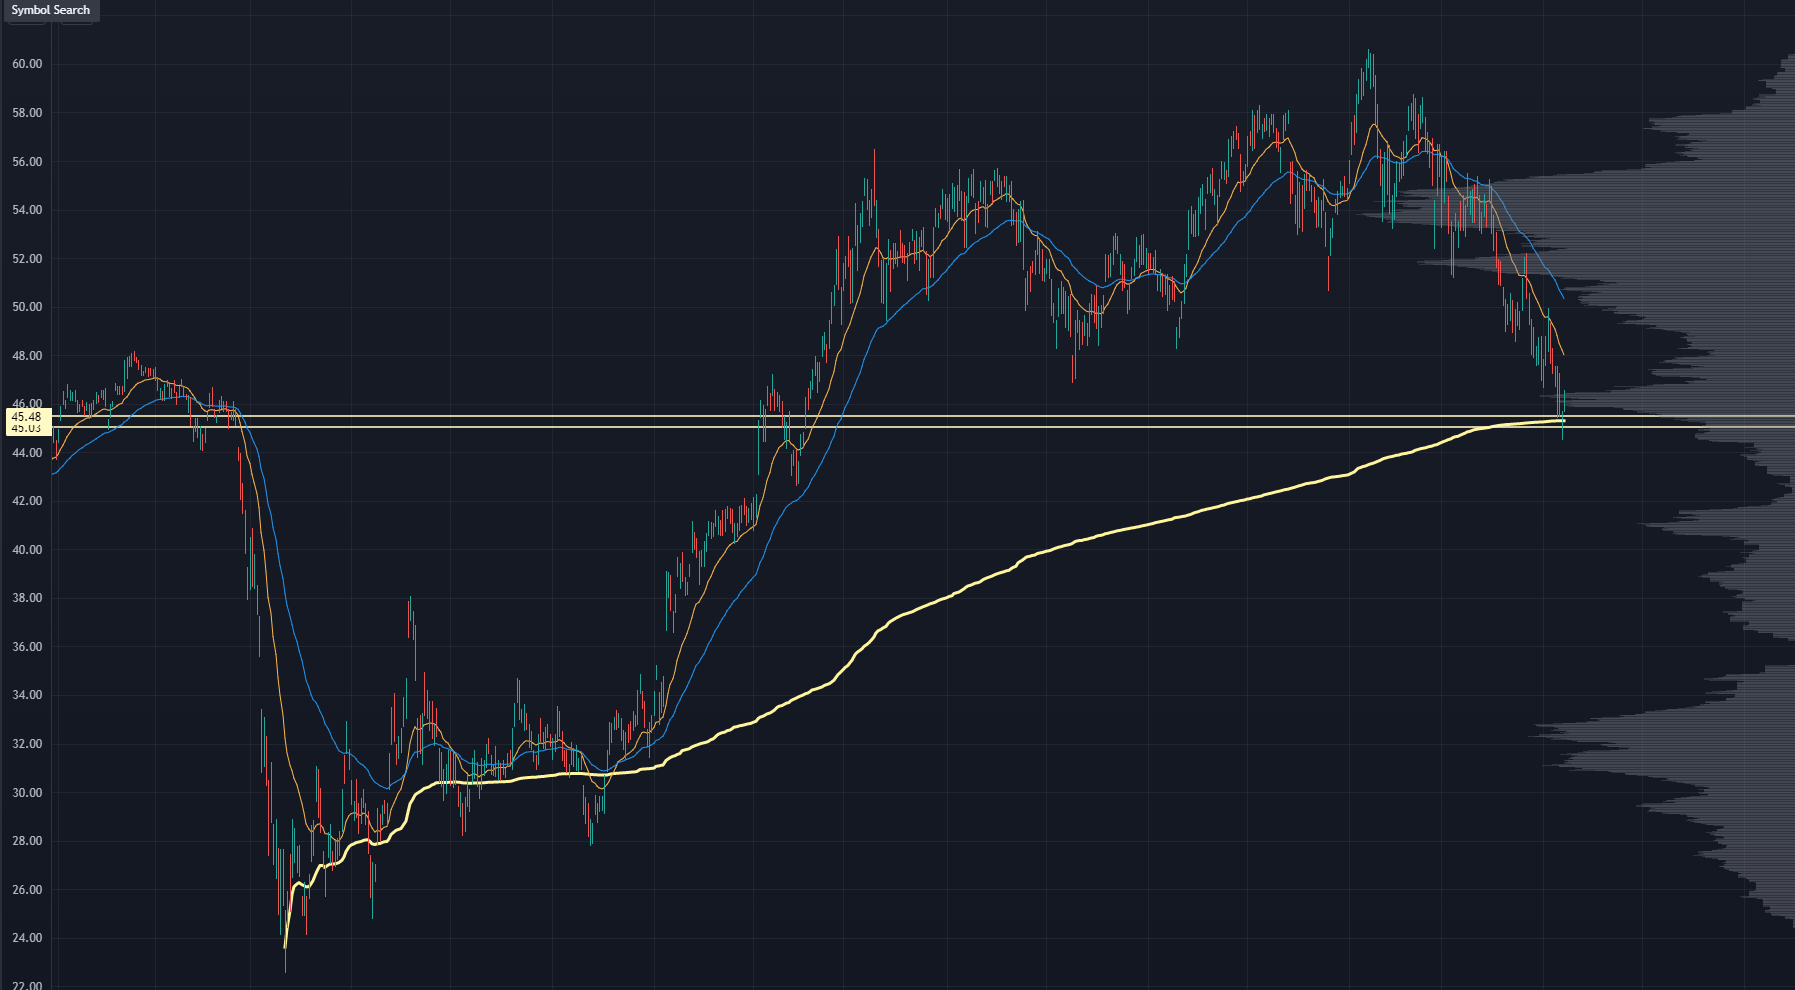
As an example, here’s KBE, a bank ETF:
KBE Chart
You can see a clean price response off the swing Anchored Volume Weighted Average Price (AVWAP) from the March 2020 lows.
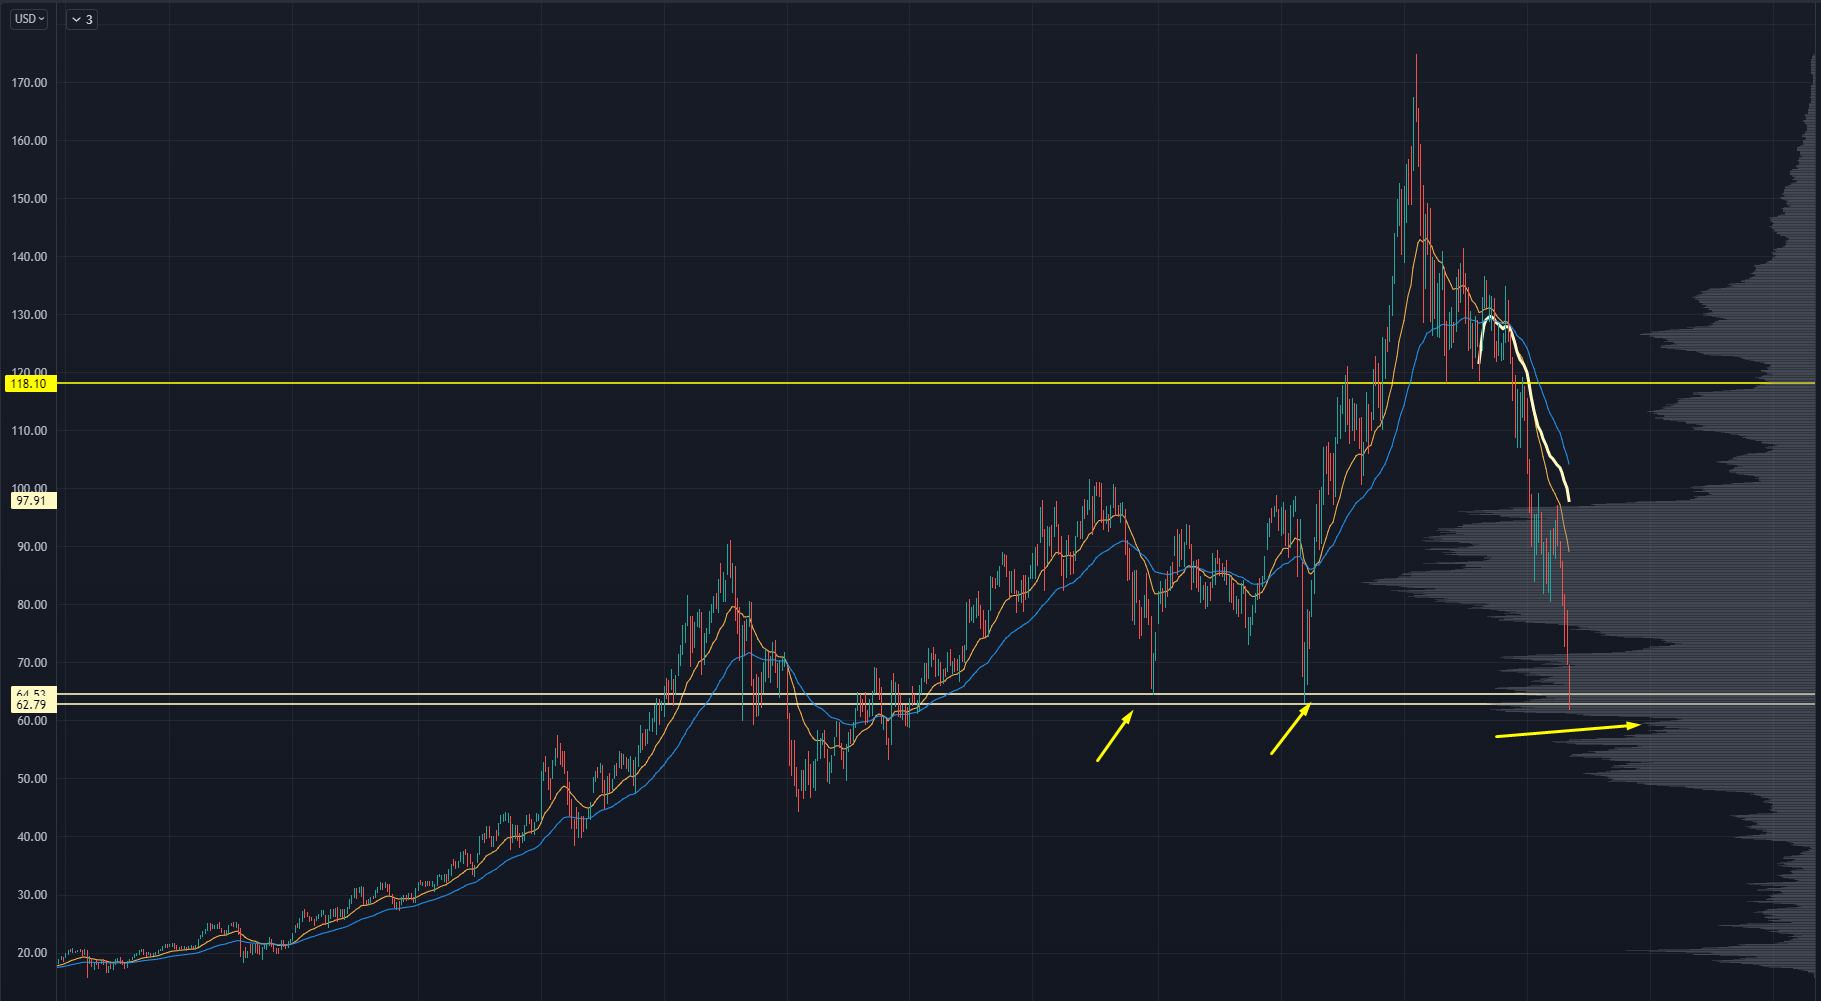
On the "high-risk" side, you have XBI:
XBI Chart
This level has provided massive price responses in the past, and it coincides with a volume shelf to help reinforce that level.
On top of all of that, the Nasdaq 100 index just saw a massive washout.
(You can read about that here.)
I think a hard bounce is possible here. I'm not calling for "THE Bottom." Just something along the lines of a bear market rally — like when we’ve seen 10% rallies off lows in the past.
If we do see a hard bounce, we’ll run into some upside levels where we want to focus on the nature of the price action.
Will we see aggressive sellers come online like in late April, or will we instead see more liquidity with buyers stepping up?
We can get a feel for that as we start heading into some key swing AVWAPs.
The first comes from the early May highs. If the market pops just a little more, we’ll be in that area fast since it lines up with our prior support at 403-405. If the market can hold its gains, the next upside target will be the 414-416 zone, an area that’s been a key pivot level all year.
Those two levels can be great bearish opportunities, but I would keep them on a tight leash.
For example, if we see the same kind of rally as in March, we could easily hit the range highs at 425. That’s the lower end of our zone, and the swing AVWAP from the April highs. That’s a much higher quality shorting opportunity in the markets.
Let's say that these recent lows don't hold...
The next monster level is down at 371, but that's far from us right now. Between here and there is a sneaky level at 377-378, which is a nested LVN that could provide some short covering.
If things get really weird, the level below that is the 363 level.
QQQ Chart
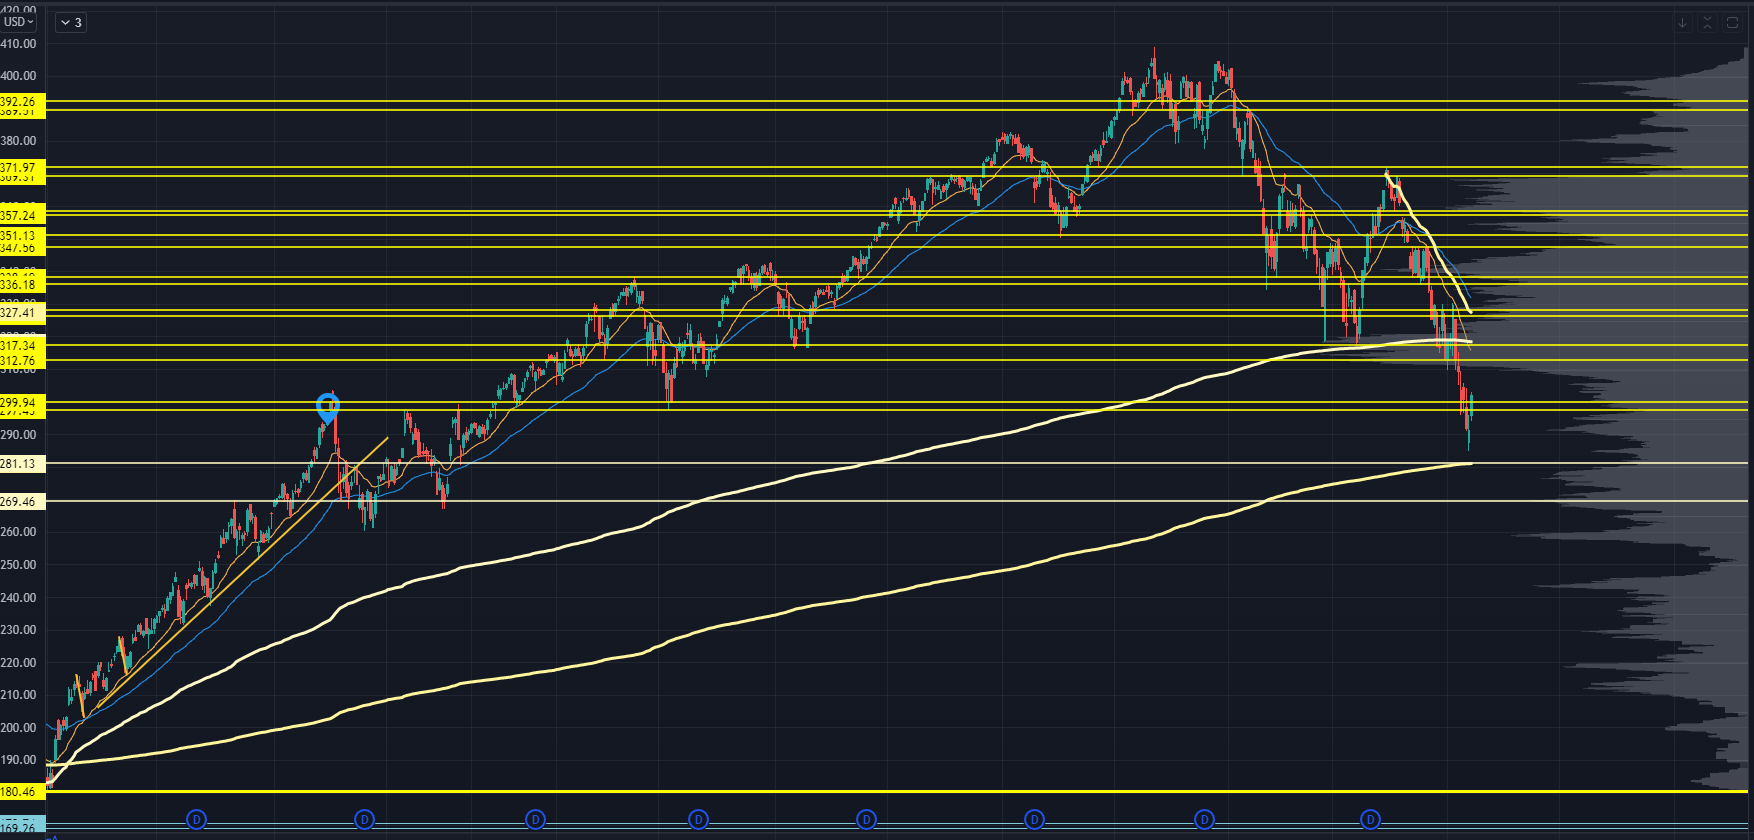
Last week, we keyed off the 300-297 level since it was the Aug 2020 pivot highs and a zone that saw massive price response in March 2021.
That level held for about 2 days, then some mega-cap stocks finally broke down, causing some acceleration to the downside.
The week’s lows didn't have anything on our Roadmap, leading me to believe it may have been driven by price responses in mega-caps like AAPL, TSLA, MSFT, and GOOGL.
There is a swing Anchored Volume Weighted Average Price (AVWAP) right under the week's lows, which is anchored from the December 2018 crash lows. Watch that one as it continues to catch up with price.
Further downside levels are around 269, and then down at 254.
In a normal market I wouldn’t call these out. But we can’t ignore those levels, given the kinds of moves we've seen recently.
On the upside, there’s a massive amount of inventory as we head into 312 to 317.
I know — that's a wide zone. But a lot of the price action lines up there.
The 312-320 range is where most of the past two years’ trading has taken place, so I wouldn't be shocked if sellers come in around those levels. If you managed to buy the dip in this market, that would be the first place I’d look to scale.
Above that is the swing AVWAP from the April highs, which would likely line up at the top of that 320 volume shelf.
If we manage to jam through that, we have the April range highs at 327, and then a key LVN at 336.
The 336 level is notable because it’d be of equivalent rally magnitude if we were to see something similar to the bear market rally from March-April.
IWM Chart
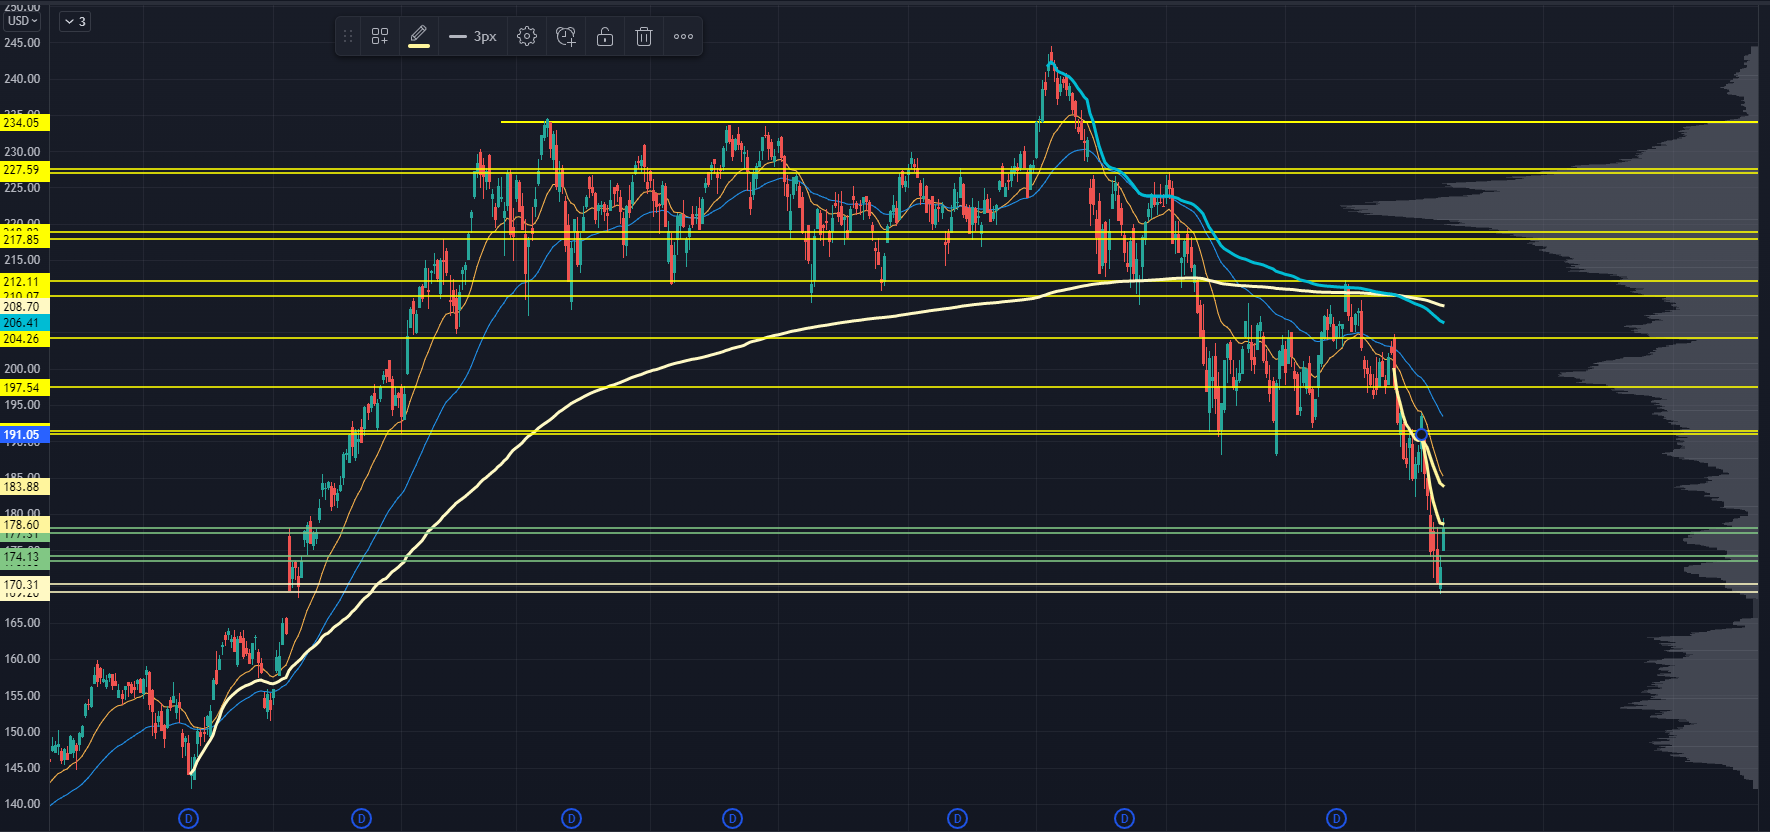
Last week, I talked about how the Russell didn't have a ton of quality levels, and it wasn't until we retested the Election gap lows that buyers started to come in.
This is a massive level… and I can't overstate how important it is to the long-term market structure for this to hold.
It's the Feb 2020 highs, prior resistance from Summer 2018, and a monster volume shelf from 4 years of trading activity.
If that level doesn't hold, our next "monster" level is a multi-year LVN down at 160.
To the upside, the Russell will continue to struggle with trapped inventory all the way back up at 190.
And because we sit in this massive volume pocket, there's not much guidance on our Roadmap between here and 190.
At 184, we have a swing AVWAP from late April’s pivot highs and prior support that could become resistance.
If we manage to tag that this week, watch for the nature of the price action. This can help us see if the most recent bottom has cleared out enough of that overhanging inventory to see a squeeze higher.
VIX Chart
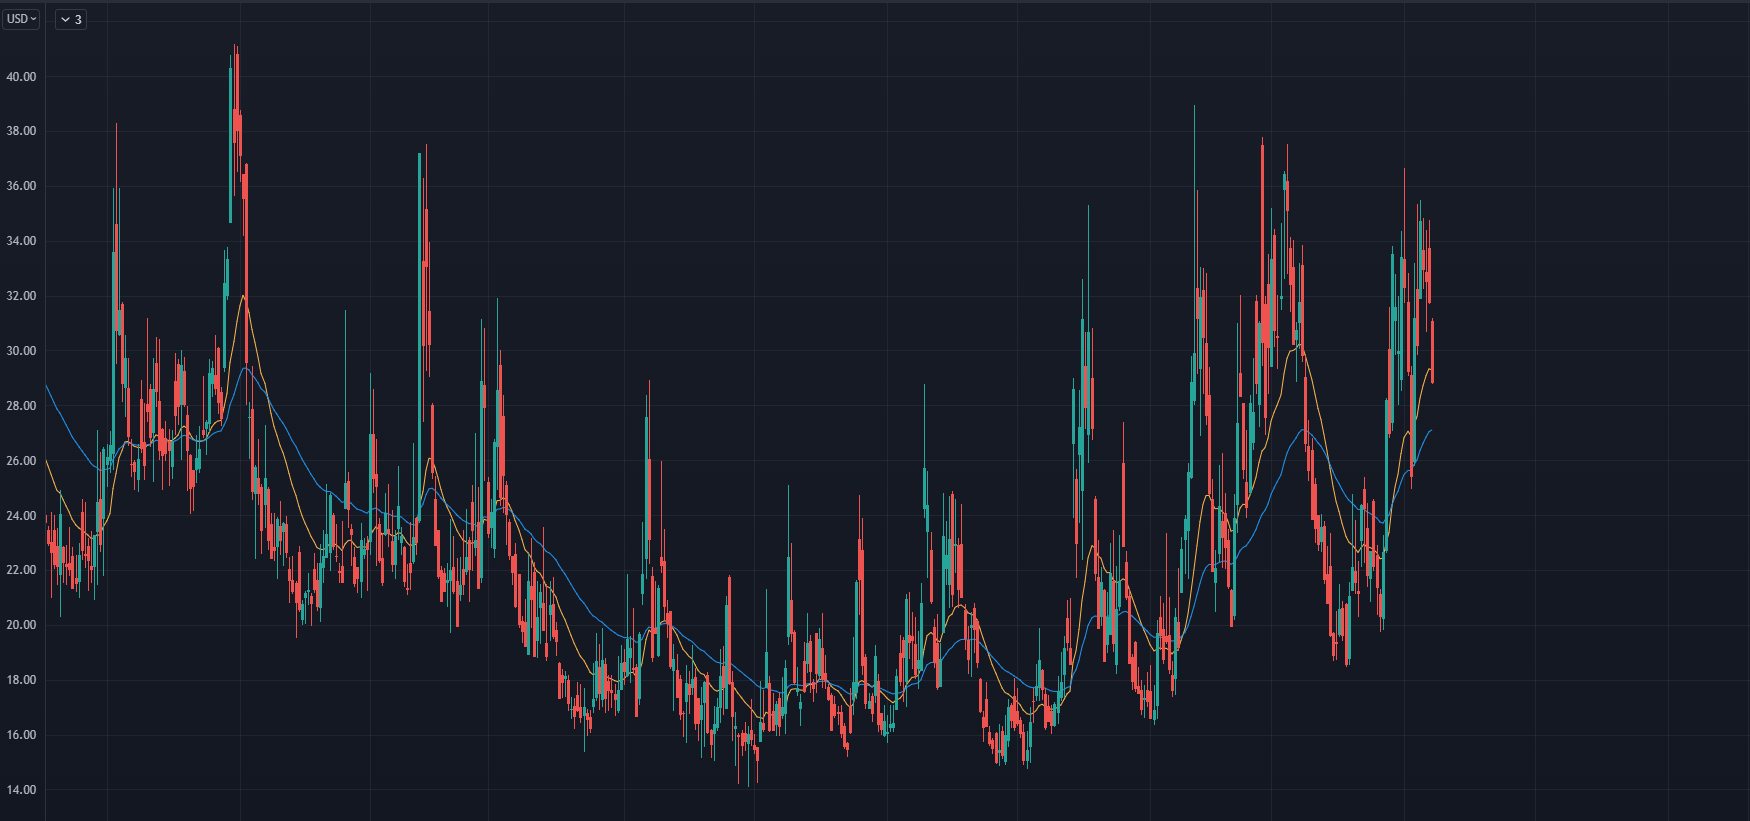
Many traders view the VIX as the "Smart Money."
I don't. They can be smart money, but sometimes, they can be really, really stupid money.
While the market was plummeting, the VIX was completely unresponsive. I was shocked to see the VIX not crack 40.
We don't know the reasons for this divergence. Perhaps hedgers are tired of buying higher-risk premia, or maybe those who did hedge sold those hedges into the most recent move lower.
Or, you could have institutions who, at these price levels, are more willing to use different hedging techniques than just buying S&P puts.
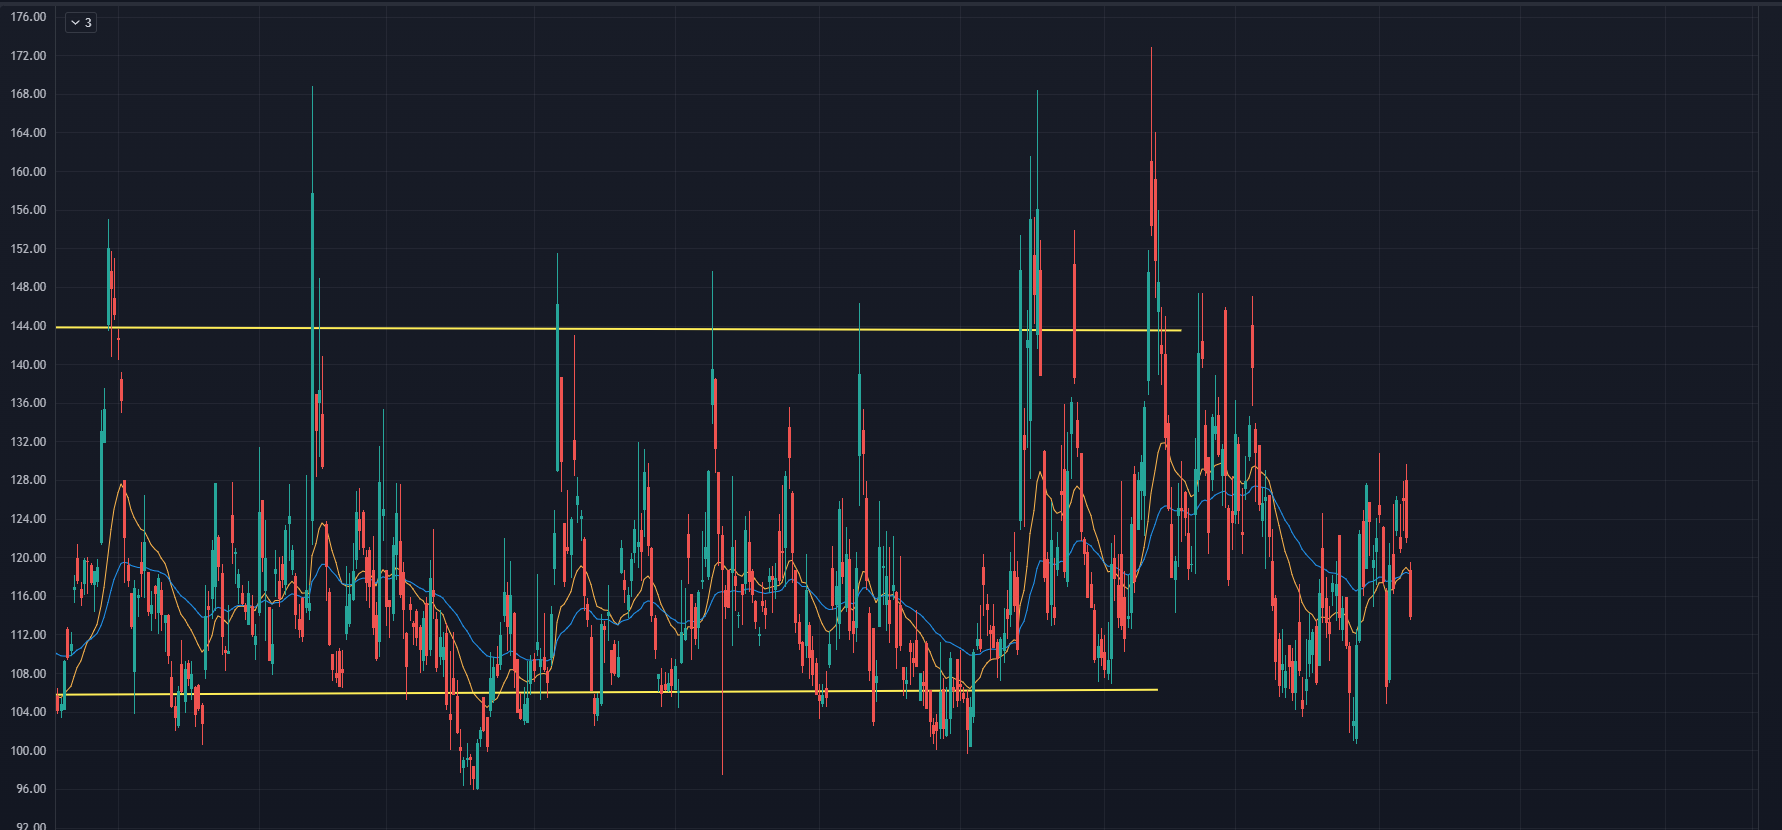
Yes, this is a massive divergence. But it's even stronger in VVIX, which shows us demand for VIX options:
VVIX Chart
VVIX readings are nowhere close to the 145 level we've called out all year. It's not even close to the March highs... in fact, it's closer to the lower end of the range we've been working with.
It feels like institutions don’t currently have the appetite for hedging any further.
Again, we don't know if this is "smart" money... but we will know in hindsight.
That said, I could make a case that this is rational behavior if we consider:
This potentially could be a signal that institutions think the worst is over... not just in terms of price action, but liquidity, too.
If liquidity returns to the market, we’ll start to see shifts in the market’s behavior and our Roadmap — and that's how you can carve out a low in stocks.
That’s all for this week’s Market Primer. To learn more about the Roadmap I used to analyze each of these indices…
Original Post Can be Found Here