The markets are a continued mess, thanks to a hawkish Fed and other sovereign entities struggling to keep up.
We saw something extraordinary last week. Fed minutes come out on Wednesday, leading to a massive move off the lows...
Only for that move to completely round-trip the next day.
That can happen sometimes. However, the associated volatility was something I don't think we've seen.
We're talking back-to-back 4% days in either direction, with no pause.
The other bizarre thing about last week was the lack of overnight volatility.
Normally, strong moves cause a followthrough effect in the Asian and European sessions. For the most part, however, the market opened up right around where it closed.
This tells me two things.
First: This market’s liquidity sucks and funds are not willing to step in front of its macro effects to the short and long sides.
Second: This is primarily driven by US-based flows and news.
This market is what I call "conveyor belt" trading, with very high intermarket correlations — not just between stocks and sectors, but between currencies, commodities and bonds.
And that last item is where we’ll start off today.
Treasuries Futures
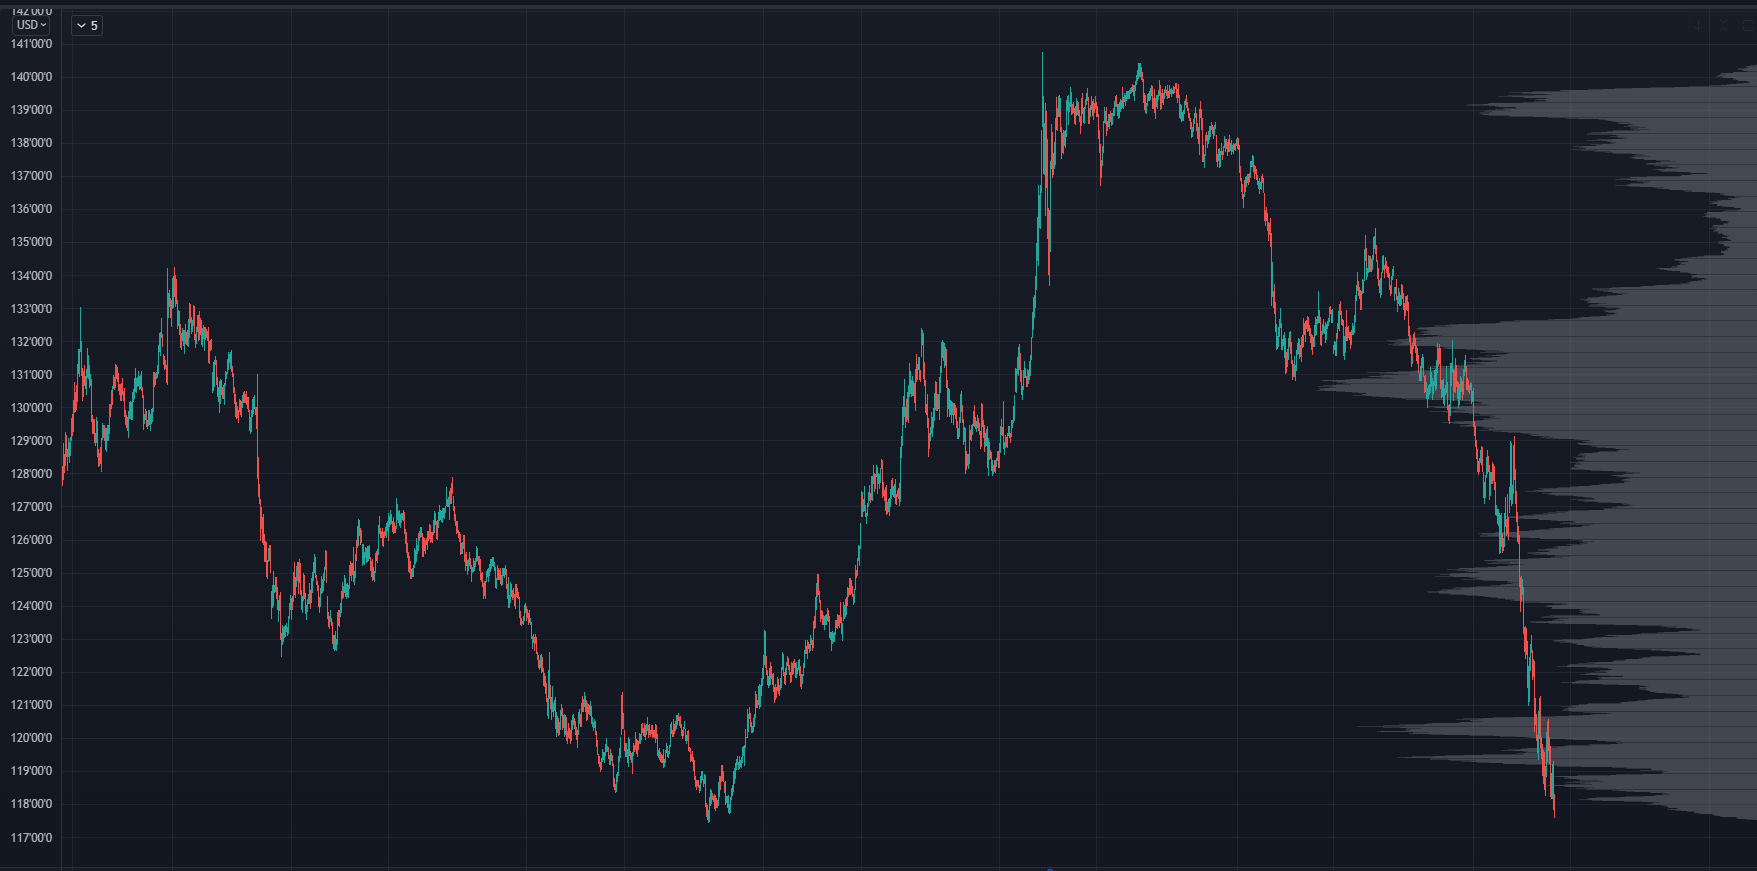
We'll start off with the 10-year futures market, which has absolutely crashed. This is the worst Treasuries selloff in decades, depending on which metric you look at.
This move has been met with about 5 days of total upside, while the rest has been a slow melt lower as rates explode.
I think a lot of the recent selling is continued deleveraging. It’s not anyone making a "new" bet on the macro landscape.
But the Fed’s aggressiveness has left many traders stuck on the wrong foot.
This is leading to massive effects in both the financial markets and the real economy. Corporate debt is now much more expensive compared to a year ago.
Risk parity funds are getting blown out. Plus, other central banks are struggling to keep pace, leading to massive rallies in USD.
Can this selloff persist further?
Sure: We can make the case for forced liquidation to continue.
But it's possible we're getting close. The 2, 10, and 20 are all coming into massive levels, as shown on our Trading Roadmap.
We can consider bonds to be in a cyclical bear market.
We know some of the strongest rallies tend to be in bear markets, and it's very possible a multi-week countertrend rally could be up on deck…
Especially if we see signs of cooling in inflation’s rate of change.
SPY Chart
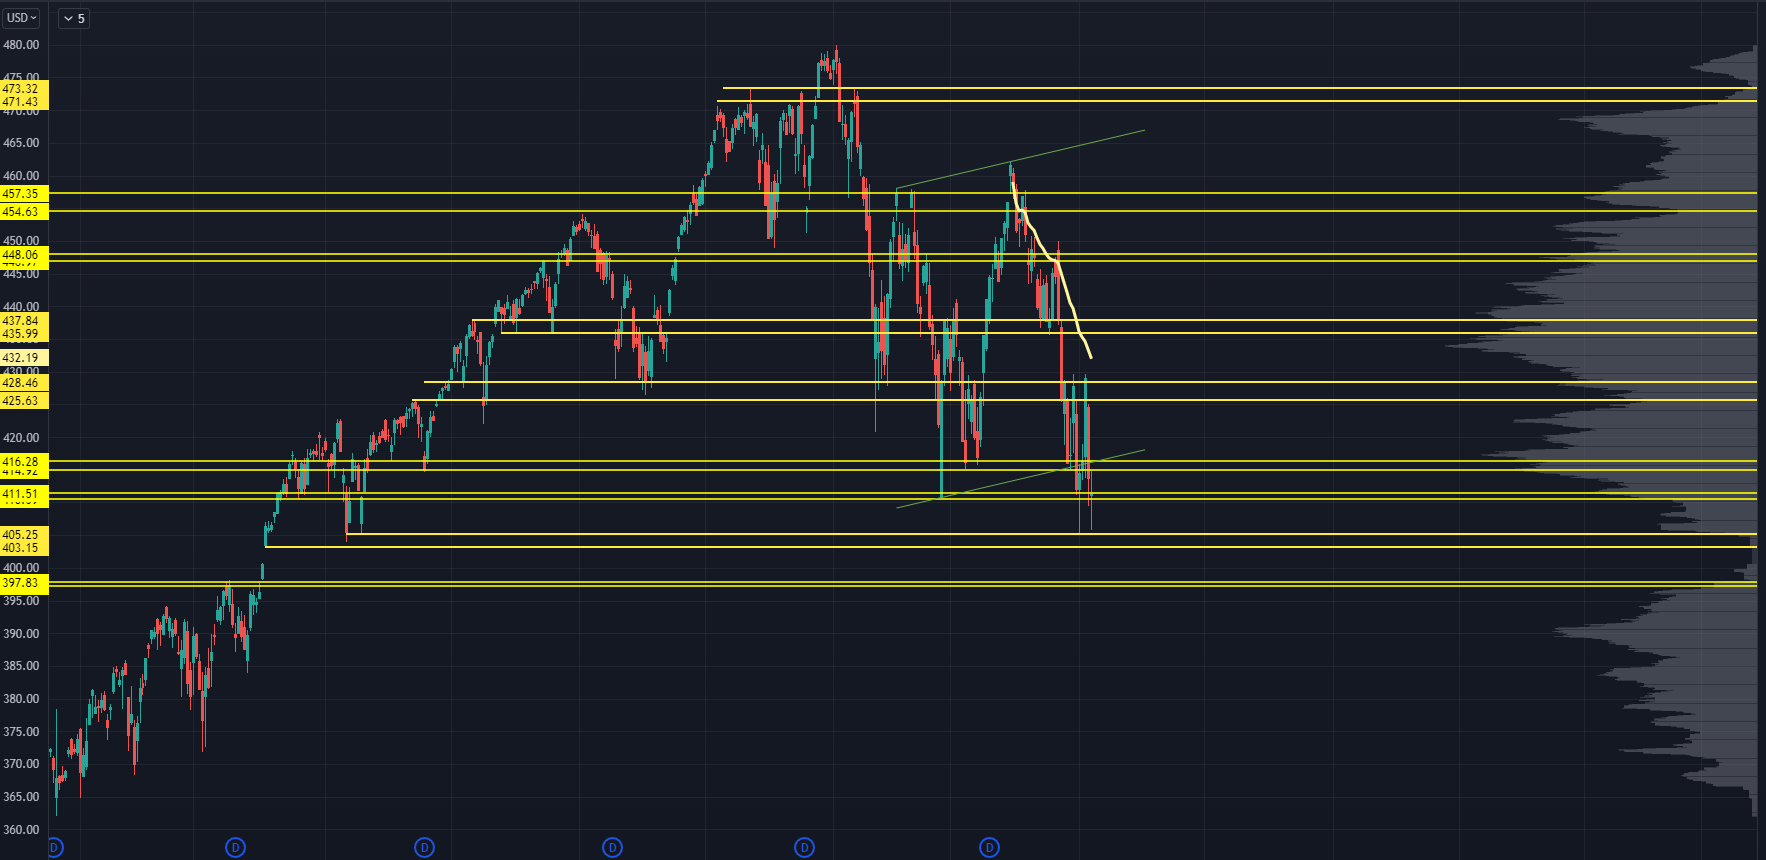
Our Roadmap levels are working out exceptionally well... and many of these zones were developed at the start of the year.
As for the next move...
We simply don't have enough information. I could see a double bottom getting knocked out, frustrating anyone who was trying to perfectly nail the bottom.
If we get and hold above 416, there's a chance we get another push to 425.
If there's a higher low after that, and we break the Anchored Volume Weighted Average Price (AVWAP) from the recent highs, huge improvements in market conditions within a short period become possible.
On the other hand... we could break the lows, and there is a massive level just underneath here in multiple asset classes.
If we get a swift move to 397, I'll be very interested in an aggressive fade.
QQQ Chart
Here's my note from last week's Market Primer:
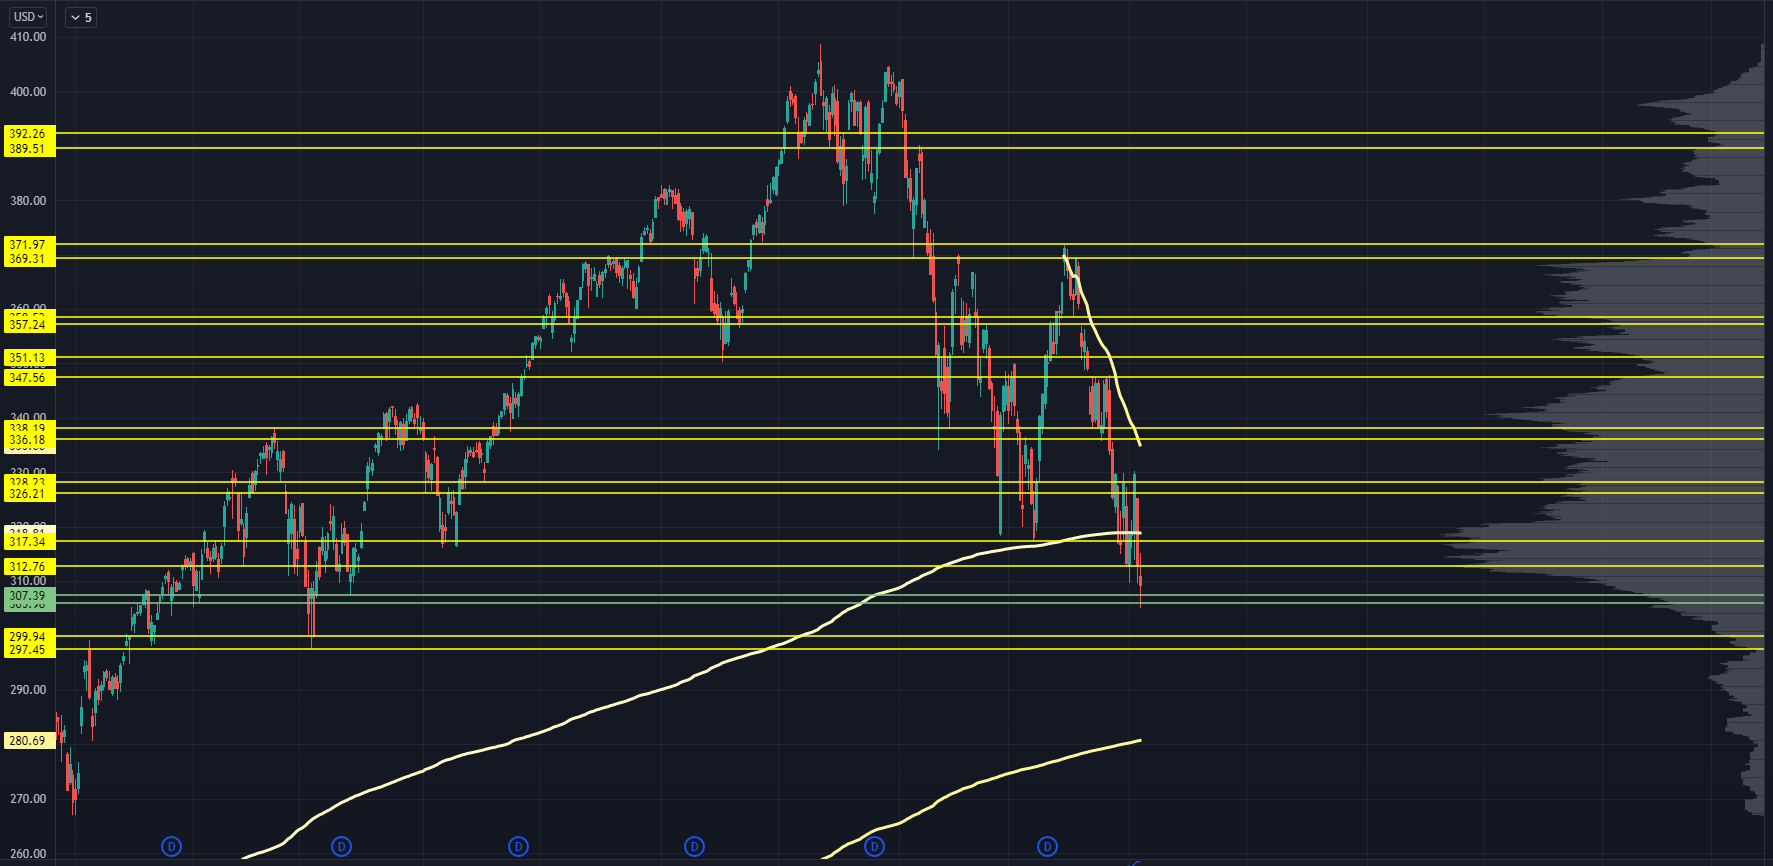
“We have a minor level (highlighted in green) that I'm not sure will be a "clean" level. But because there’s so much distance between here and 300, I had to find something.
It's an internal pivot level and a minor low volume node (LVN), so I'm not giving it too much weight. Other than that, we could see a tricky "failed breakdown" if we really wanted to piss off the majority of market participants.”
That was the level that was tested and held on Friday.
Now Friday’s bounce could’ve been some short-term rebalancing, but that level is now important after the response we saw.
Exact same kind of path dependency as with the S&P. If we get and hold above 317, we've got a push to the swing AVWAP and the 326-328 zone.
And just underneath here — under 300 — is a huge level.
We've talked about that for weeks, and it’s especially in play in the early part of this week.
IWM Chart
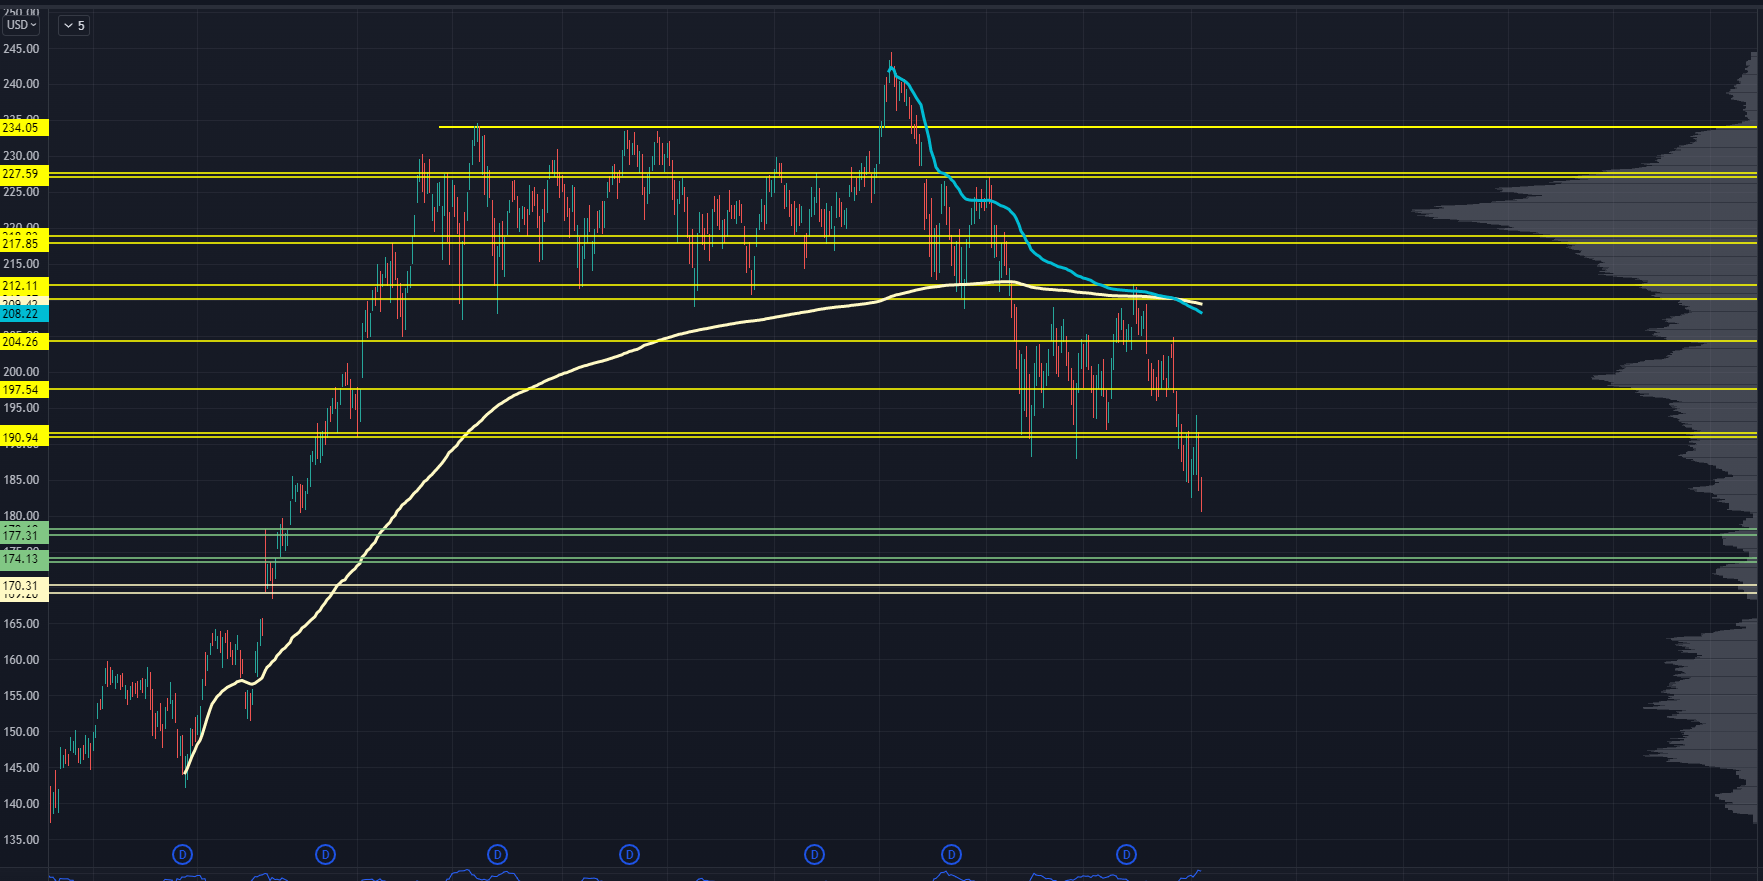
Due to the low volume rally that happened after November 2020, I don't have much of a feel for how the Russell will trade in this area.
We do have some levels coming up around 177 and 174, but that doesn't mean we’re entitled to them.
The upside to watch is still 190. If we get that and hold, it could be enough to change sentiment and force people to run the other way. I wouldn't be surprised if this was tied to bonds.
VIX Chart
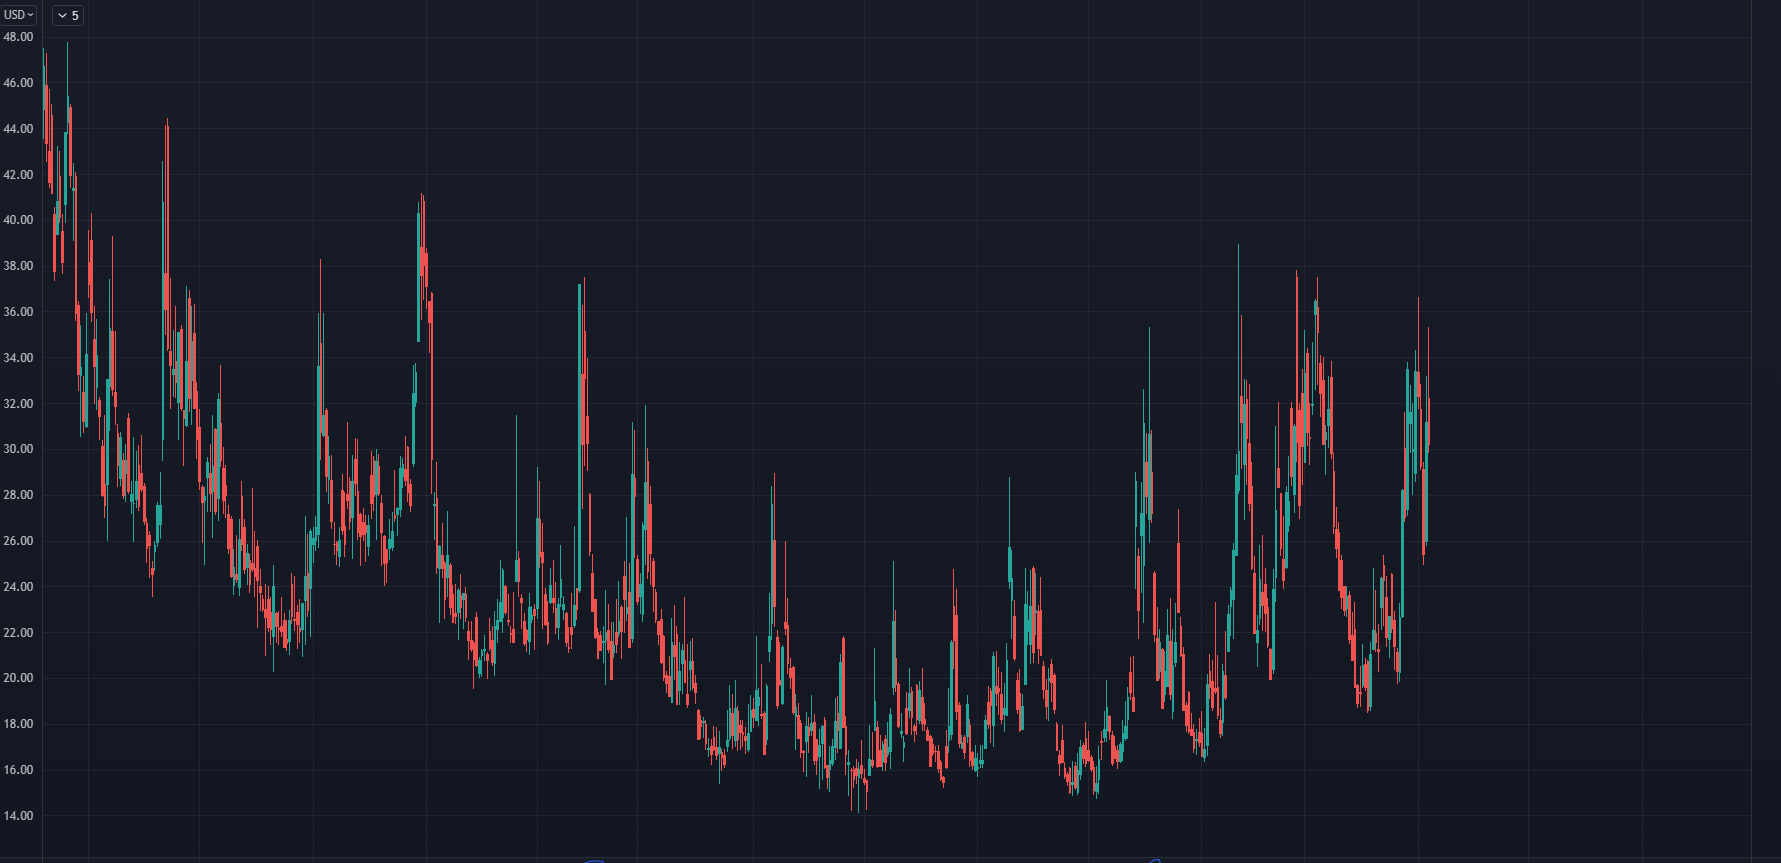
After the Fed voodoo on Wednesday, we saw some air come out of the balloon in hedging, and VIX ran from 32 to 24.
The market rally was probably driven by some of these flows, known as a vanna squeeze. Then the reversal on Thursday brought us back into the low 30s, and it's just holding.
This isn't exactly reflective of a bull or bear market… but in overall liquidity.
And to be fair, a VIX of 30 is way too low given the realized volatility we're moving at.
To put this in perspective... a 30 VIX implies we should be seeing 1.8% moves most of the time.
When the market’s ripping 4% a day, that means the VIX is currently calling the bluff of the realized volatility regime.
I'm not saying this is a pure signal. Either we start to roll over in risk again, and the VIX gets blown out…
Or we pull into the 20s, and another vanna squeeze is up on deck.
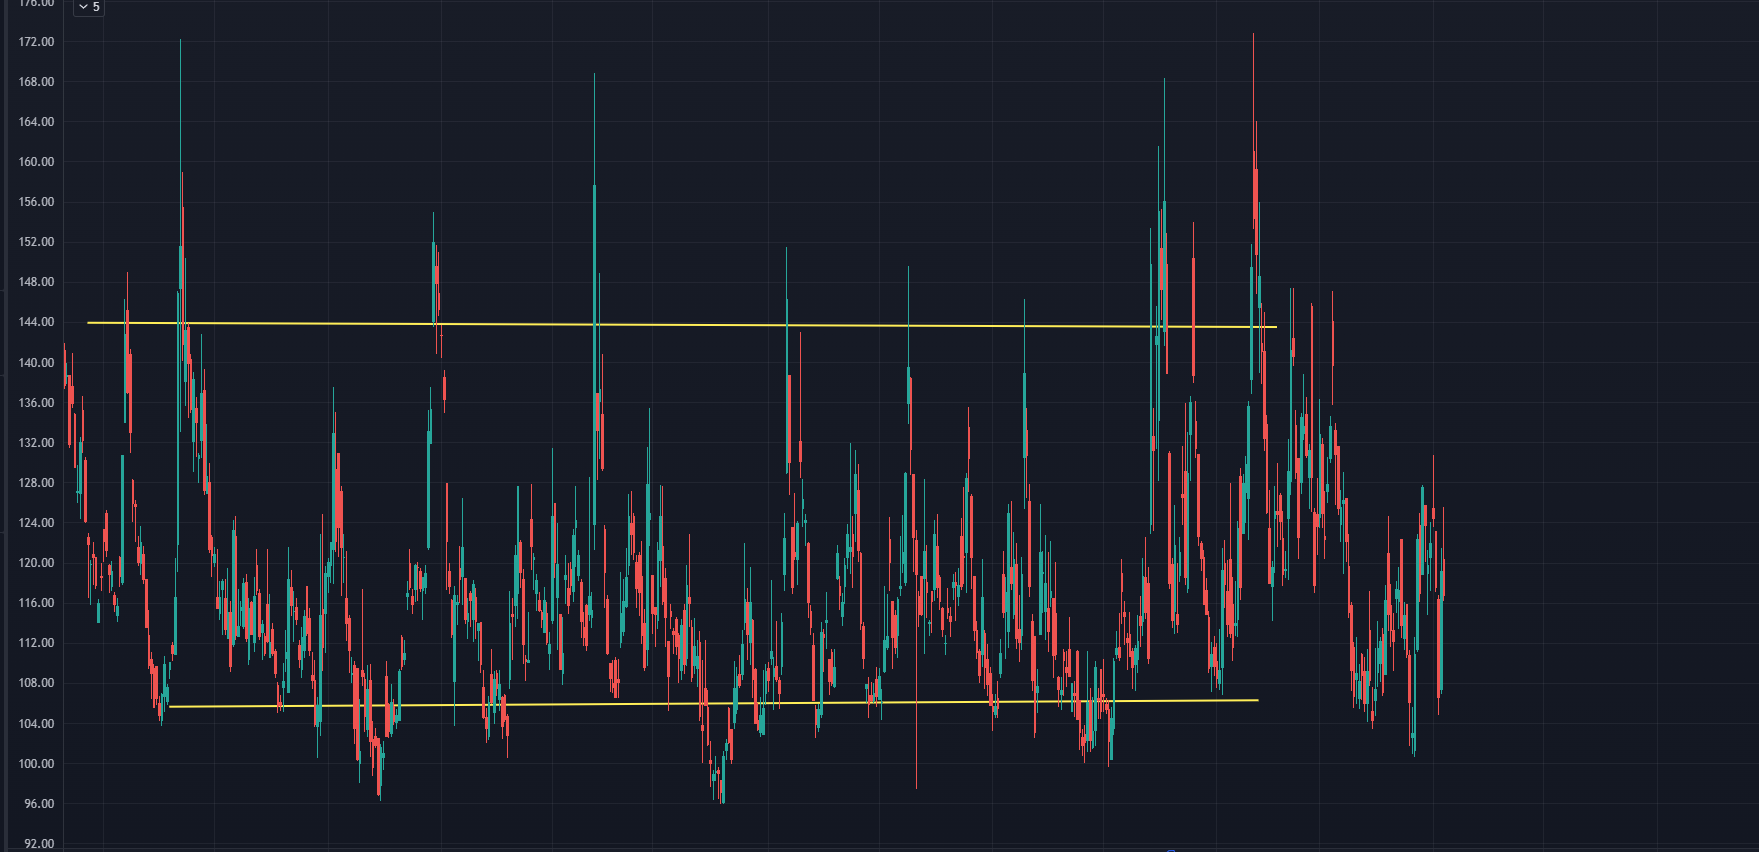
One worrisome indicator is VVIX:
VVIX Chart
There isn’t enough demand for VIX options right now.
Either a lot of investors are overhedged from longer-term instruments, or there aren’t many folks interested in buying significantly.
If you need a hedge, I highly recommend looking at VIX call spreads.
Anyway, that’s all for this week’s Market Primer.
PS: if you want to equip yourself with the Roadmap used in this Market Primer…
Original Post Can be Found Here