If you’ve traded for longer than a few weeks, odds are you’ve been “stuck” in a trade.
You know the one… you buy the dip, then it dips and dips and dips.
All of a sudden, your trade becomes a “long term investment.”
Because it’s hard to take a loss, right?
And you know what… maybe you get lucky and the stock bounces back and all you think is “get me out at breakeven!”
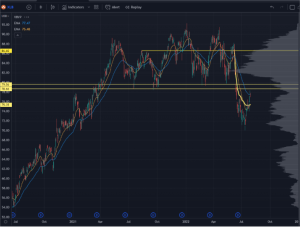
Here’s today’s chart of XLB, the SPDR Materials ETF:

XLB Chart
There are about 300 days worth of traders who have a much worse buy price than what the market is currently at. There was a trading range between 78 - 90, and anyone who bought during that range is now “stuck” holding the bag.
What do you think they’re going to do if we get one more push higher?
They’re going to reconsider their “investment.” Because they don’t want another repeat of the summer crash lower, so maybe get out at breakeven instead.
This is what you should be looking for if you want to take a short trade on names like this. And while there’s a juicy pivot level coming into play from 78-79, there’s one more spot around 82 where most of the volume has traded over the past few years.
That’s the spot I’d like to play.
Do you know why we look at that level? It comes down to our Trading Roadmap.
So go watch this presentation to help you understand how we do it and join the Roadmap.
Original Post Can be Found Here