

We’ve already covered the first two inflation narratives (you can get up to speed on those right here if you missed them).
Now let’s talk about the third and fourth…
If you’re an employee at a large tech firm, things are still sailing smoothly for you.
Salaries are still high, there haven’t been a ton of layoffs, and you still get all your meals cooked for you at Google’s headquarters.
Of course, economic returns aren’t evenly distributed, and there’s plenty of disruptions along the way. It also doesn’t help that groceries are 25% more expensive than they were four years ago.
Put aside all the boomer macro takes for a moment… because while they do drive the primary narrative, we will most likely not see prices confirm the economic weakness.
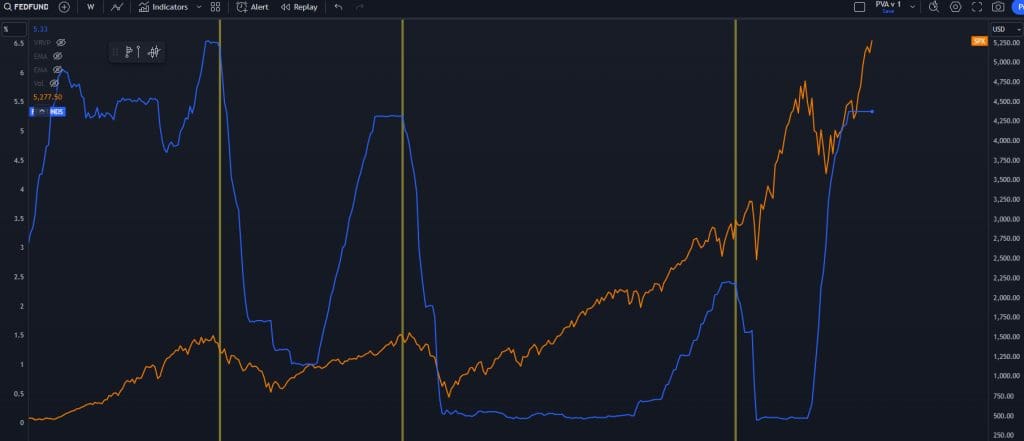
This is a chart showing the Fed Funds rate and the S&P 500.
In 2000 and 2008, they waited too long to cut and it didn’t help things.
In 2018-2019, there were some signs of deteriorating economic conditions, starting with a nasty move in equities and credit in December 2018 that forced the Fed to be more accommodative in their actions.
Had COVID not hit in 2020, we probably would have had a proper recession, but the monetary and fiscal response truncated that move.
There are hundreds of stocks that simply haven’t moved while about seven stocks make up for the majority of gains and liquidity in the market.
Some of that is because you can get a 5% yield on US Treasurys, so you don’t have to take a bunch of risk in the equity markets to get a solid return.
If the Fed pulls back on rates, some of that math will change with respect to liquidity, bu you’ll also see an improvement in credit conditions.
A very good example right now is Rackspace Technology, ticker RXT, which is one of our model portfolio holdings right now.
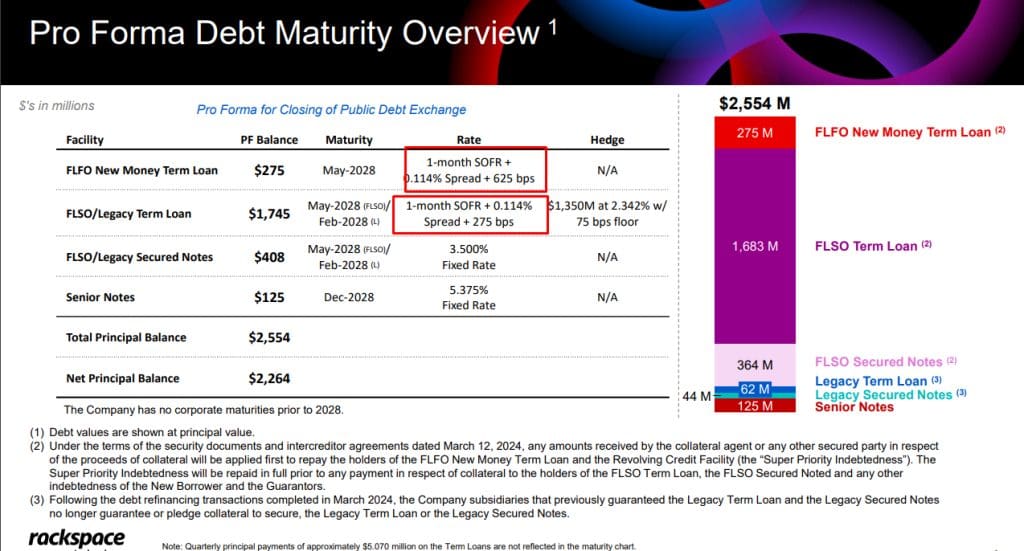
They are a private equity spinoff, which means they have a ton of debt. That debt is at a floating rate, and it’s tied to the Fed Funds rate.
Some quick math tells me if the company has that debt exposure, they have to pay about $85 million just in interest payments when the Fed rate is at 0.5%.
But the Fed rate is at 5.25%… which means they have an interest rate payment of $117 million.
The Fed Fund Futures are currently pricing cuts that take the rate down to 4.75% as we head into the end of the year.
Assuming all else remains equal, this reduces the interest payout down to $113 million.
That doesn’t seem to move the needle a ton, but an extra $4 million can start to matter with respect to the flexibility of the firm.
This is one of the reasons smallcaps have been lagging for a few years. The cost of money is too high for these small firms and they can’t get good terms on debt rollovers. They can’t go finance in the equity markets as the lack of liquidity would tank the equity of the company.
If the Fed starts to cut, we will most likely see a hard rally in smallcaps, banks, and other names that have higher debt loads. We’re not talking fundamentals here, we’re talking narrative.
This is important! Because the economy will start feeling terrible in the real world, but there will be a disconnect in the markets as breadth starts to work more.
A quote from an article:
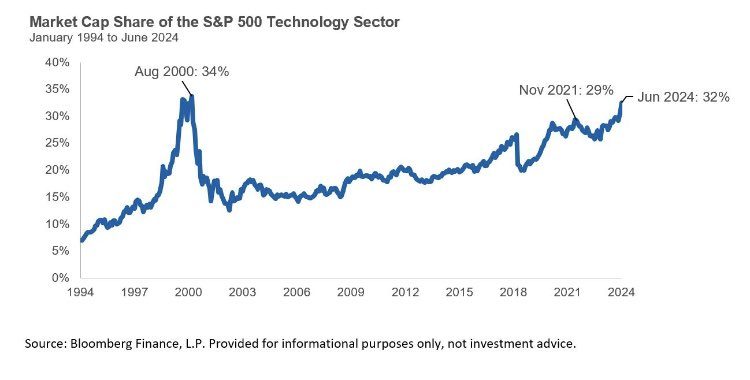
Just a handful of names have been pushing the gains on the indices much higher.
There has been a lack of breadth in this market. More and more capital and liquidity are crowding into the same names like Nvidia (NVDA) and Apple (AAPL).
This relationship can persist longer than you think. I remember noticing this back in 2017, and it took six months before the squeeze stopped.
Some of this can be blamed by passive indexing and how the indices are structured. That’s going to be a market-cap related squeeze.
There’s also a ton of options-related games going on. The liquidity on the straight equity sucks so much that the options market can push the market around on a string.
It’s not just zero-days-to-expiry options on the S&P 500 – it’s also the options markets in NVDA and the other large cap tech names.
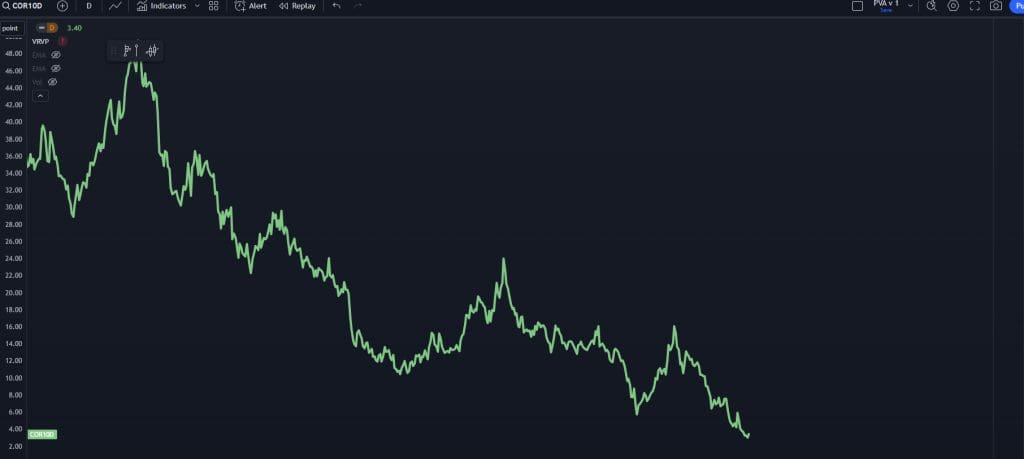
This is a chart of COR10D, which shows us the implied correlation in the S&P 500 for 10 delta options.
I understand we’re getting into some advanced options witchcraft but if traders don’t understand these mechanics they probably shouldn’t be involved in the current markets.
If you have very high correlations, it means the market as a whole is moving on a big conveyor belt of risk. This usually happens when we have volatile markets as things are being bought and sold in large baskets.
Right now we are in a very low correlation market as it relates to OTM call options. This is usually in a solid bull market but the breadth is also low.
So what does all of that mean?
The crowd is crowded. They’re all in the same handful of stocks, and that could present a liquidity risk in the S&P 500 and Nasdaq, along with the largest components.
But here’s the thing– a reversion of this doesn’t mean a collapse in the market.
It means rotation.
At the time of this writing, NVDA has a market cap of 3.1 trillion dollars. That means a 1% move is the equivalent of $310 billion.
If that liquidity ended up being spread throughout the rest of the market, you would get a bull market where the laggards start to play catch up.
We are starting to see evidence of that. Here’s a daily chart of QQEW, which is the equal weight index for the Nasdaq 100:
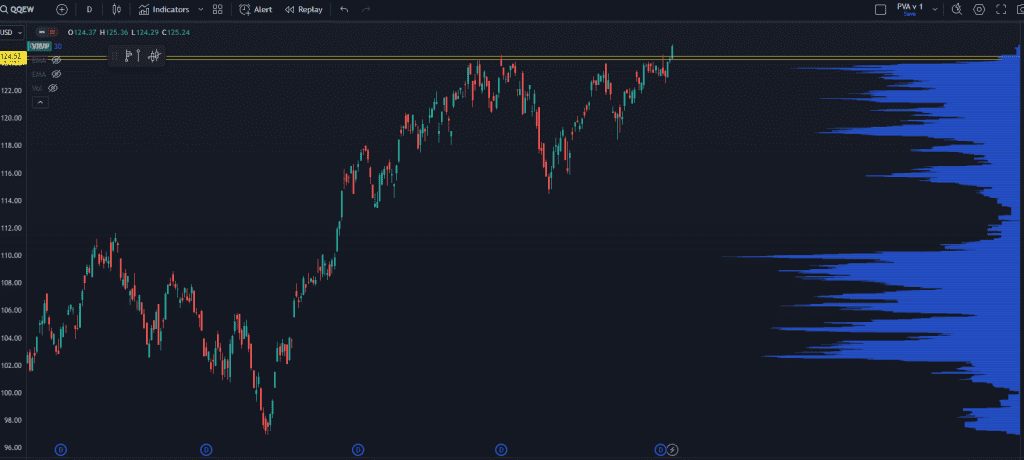
Clean breakout. This isn’t bearish.
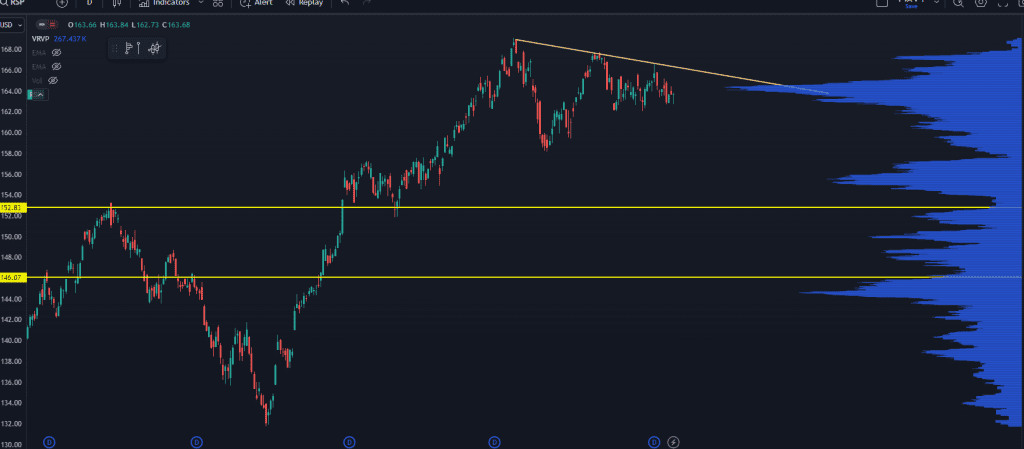
The same holds true for RSP, which is the equal weight S&P 500 index– a massive POC buildout up here and the possibility of a hard rally after that.
Here’s the basic thesis that I have for the second half of the year:
So what’s going to change?
The Fed has some decisions to make. And the vibe will shift during that time as price action starts to respond in a way I’ve described above.
More investors will be trying to chase trashier names with high debt loads as there’s anticipation that lower rates will mean easier money for these small/mid-cap companies.
And as all these play out, we’ll still be using our market roadmap to find high-potential, low-risk opportunities – click here and I’ll show you exactly how it works and what some of our past winners have looked like.
Original Post Can be Found Here