


When people just get started trading, they think playing the markets will be “clean.”
Here’s a typical example from a “traditional” technical analysis handbook:
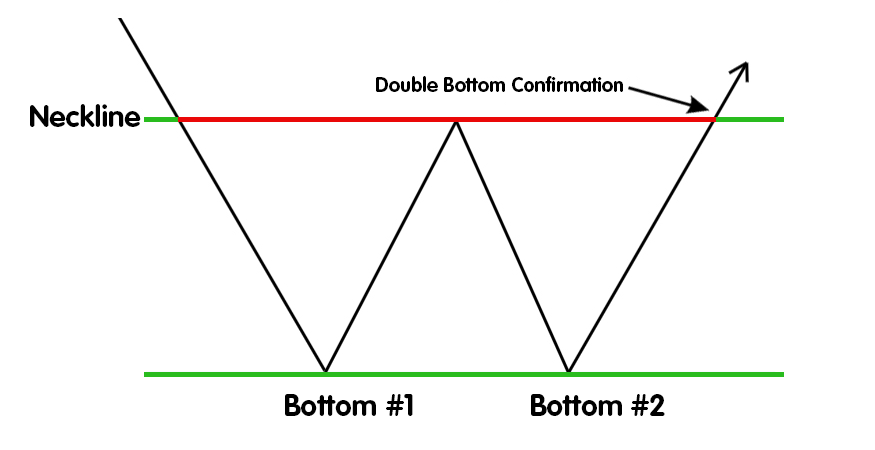
Double Bottom Chart
And in the real world, things always work out just like that… PSYCHE!
It’s like watching a Kung Fu movie vs seeing an actual street brawl.
One looks cool, the other is a hot mess and you hope you don’t end up on the ground.
Here’s what the SPY looked like headed into the close on Friday:
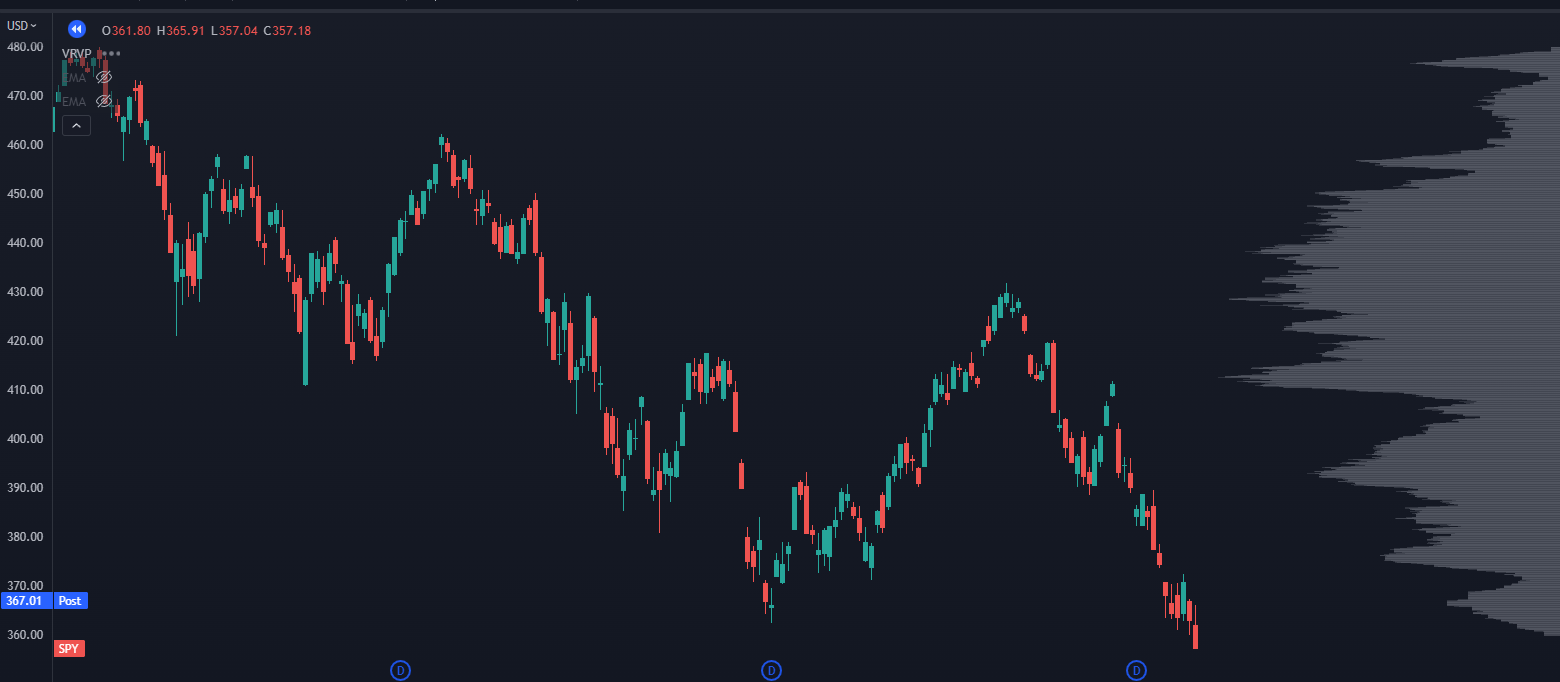
SPY Chart
It’s pretty ugly price action with a clear breakdown below the June lows and everyone expecting a major gap down on Monday.
But what we got was quite a bit different.
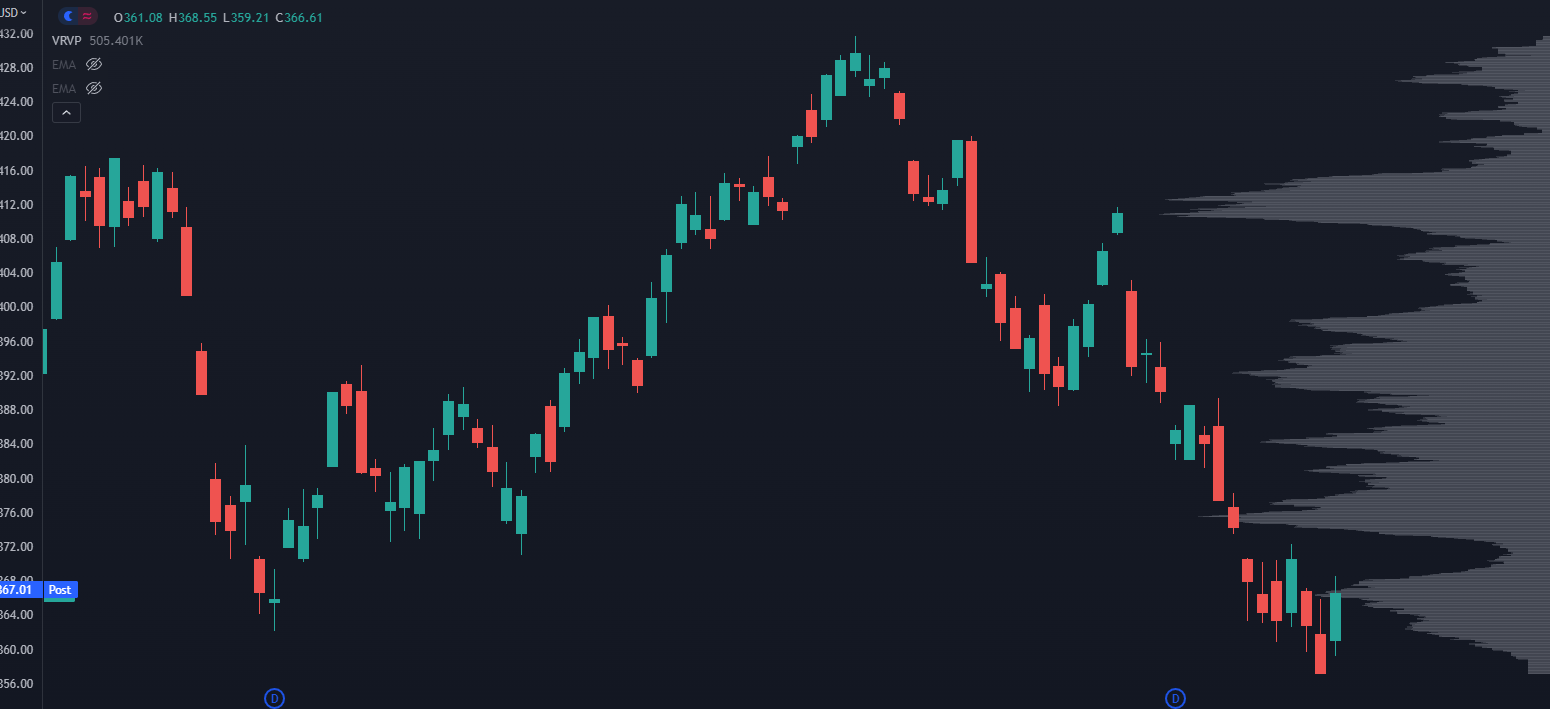
SPY Chart
Not only back up above Friday’s low, but above the high… and Thursday’s high as well.
Right now, this has the look of a “failed breakdown.”
And those can be incredibly powerful patterns.
When we see a push past an “obvious” level, but we don’t see any followthrough, it means that there aren’t as many participants willing to trade at that level.
And if we see a snapback, then we can call that a “failed auction.”
And from failed moves come fast moves.
Now I don’t think any countertrend rally is going to get us 20% in a straight shot… here’s the SPY with all the levels I’m watching:
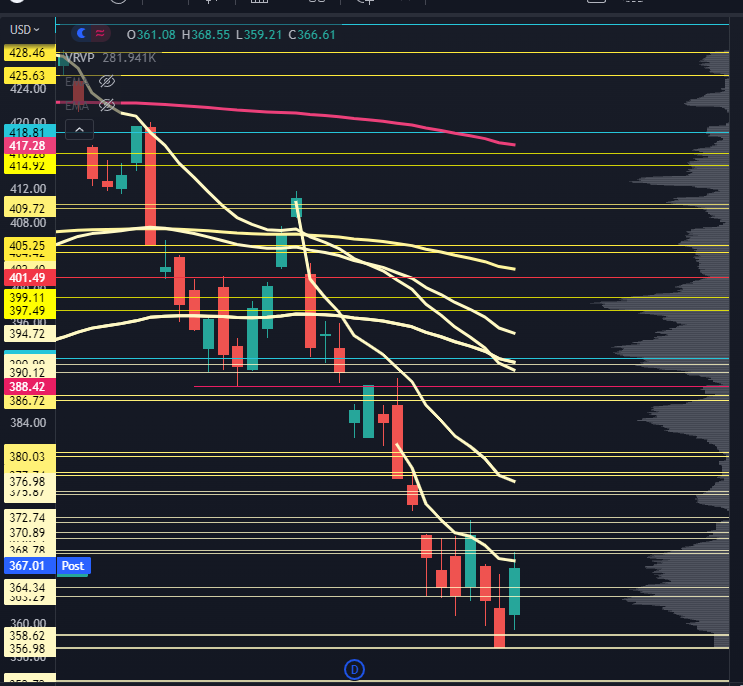
SPY Chart with Levels
Participants on multiple timeframes are in a drawdown, and there is plenty of inventory that can be sold into on any pop.
With that said… we have seen many instances where a “failed move” lower has led to major market bottoms. I don’t want to make any guarantees, but here are some examples from my market memory:
2016, both Brexit and US elections:
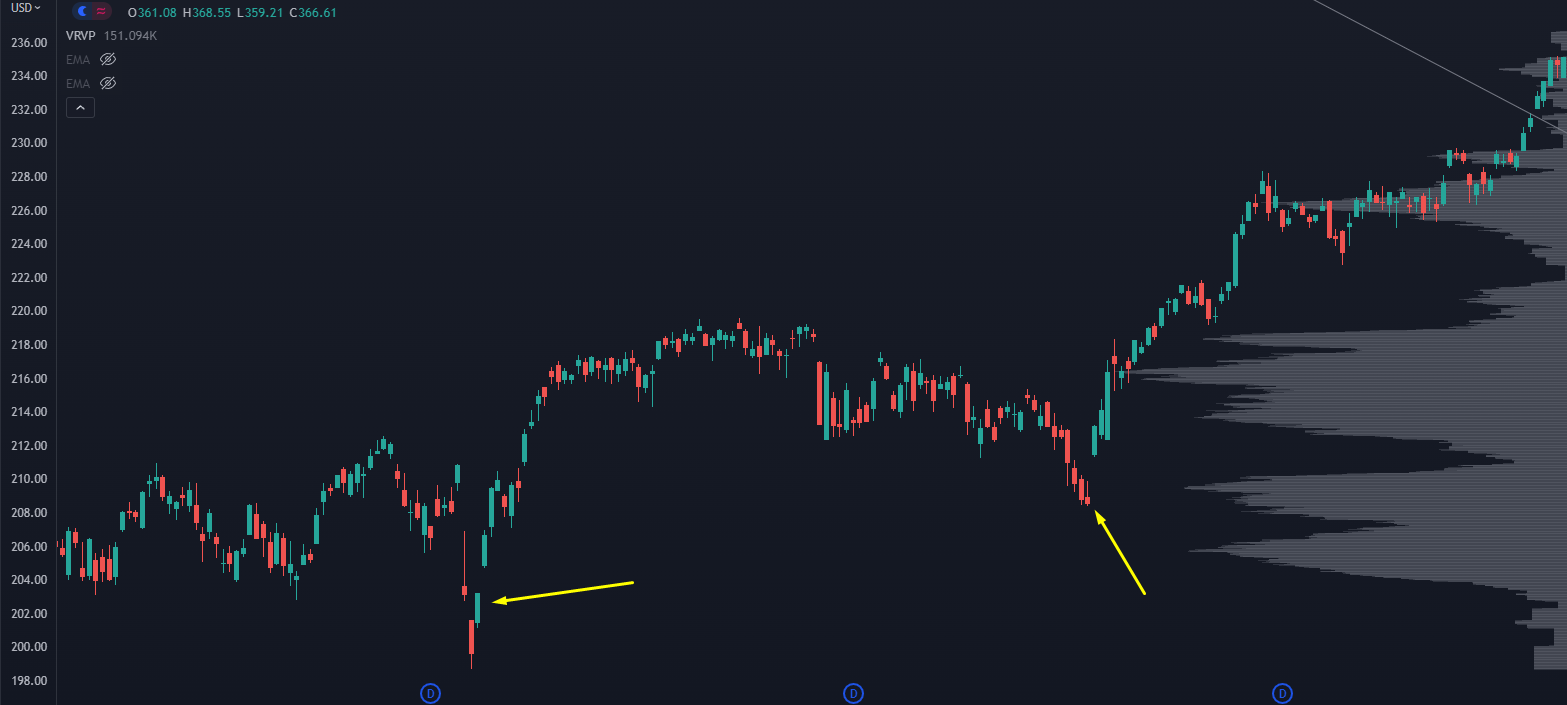
SPY Chart 2016 bottoms
2016 Taper Tantrum
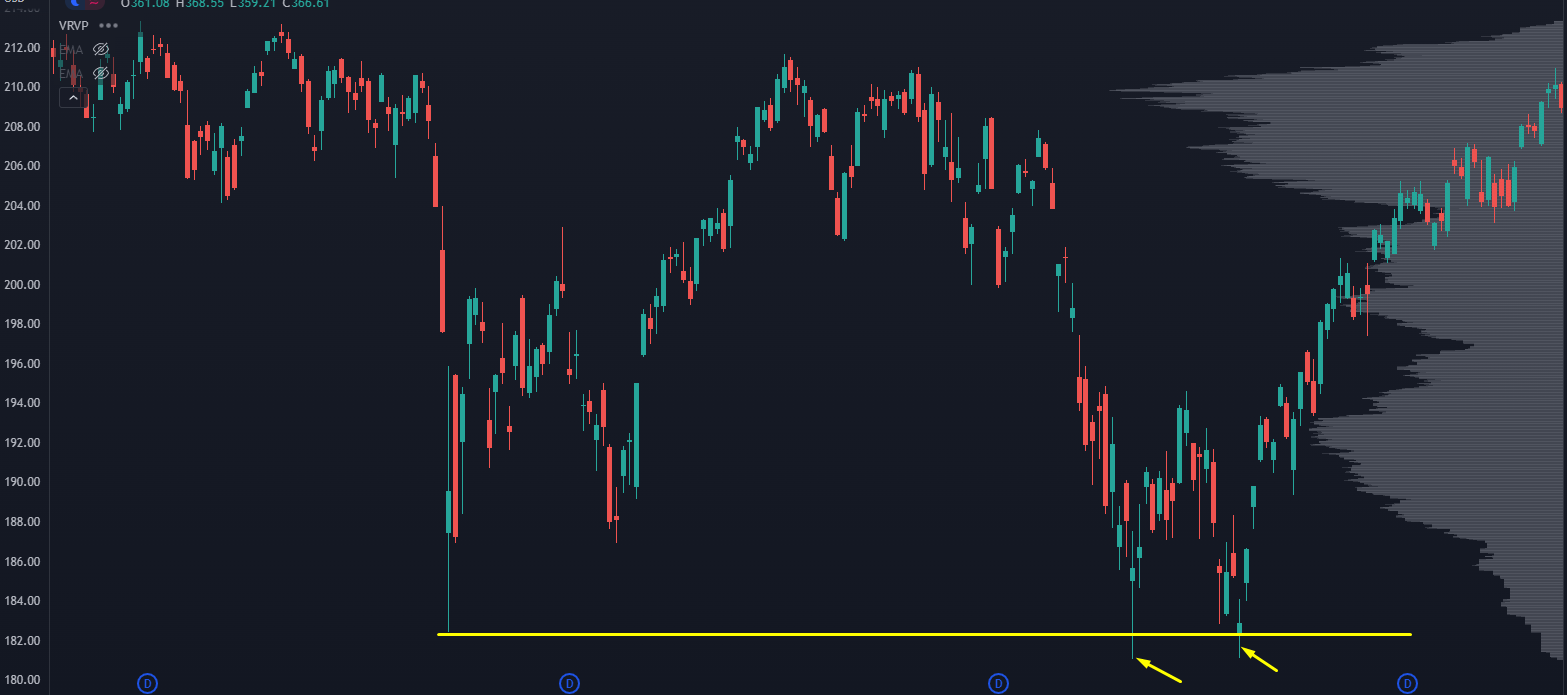
2016 Taper Tantrum Chart
2011 Fiscal Cliff
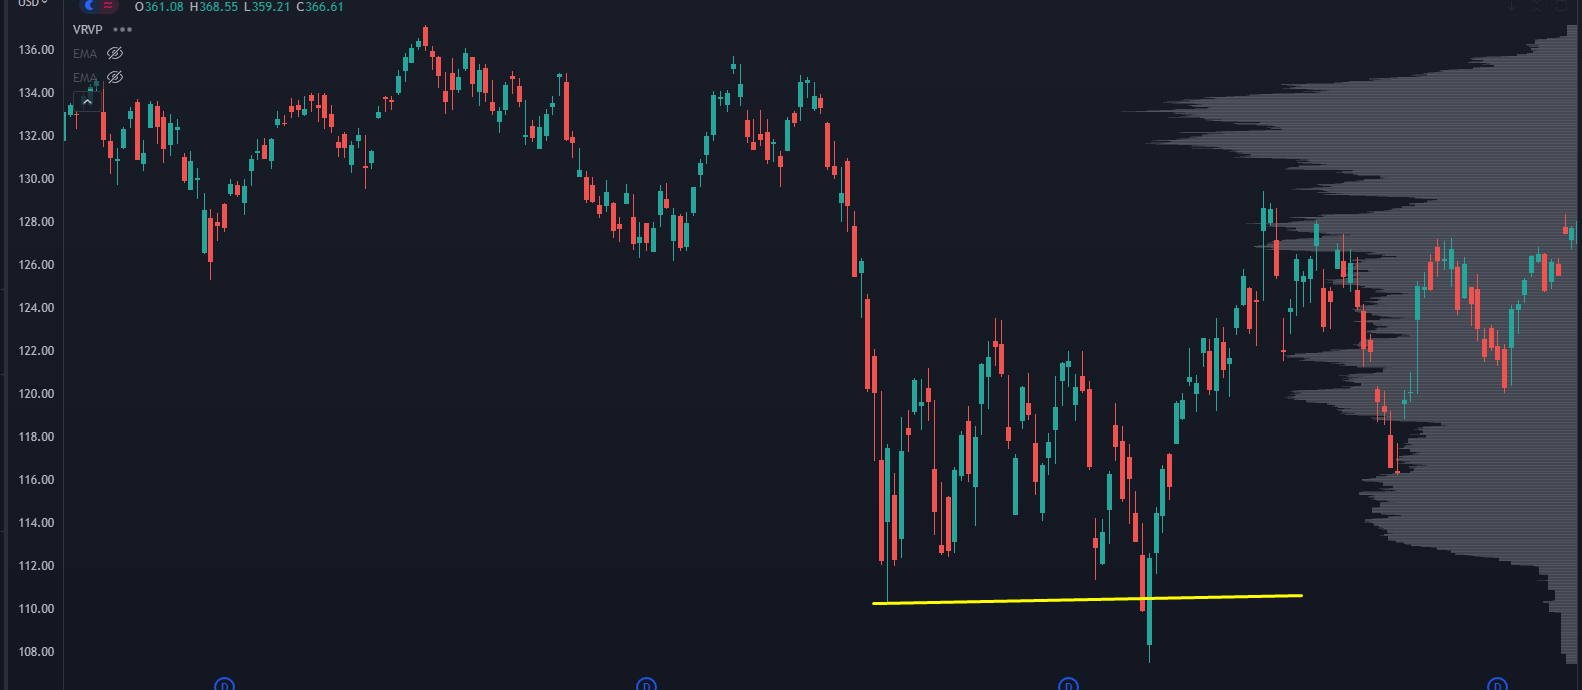
2011 Fiscal Cliff Chart
2010 Post Flash Crash
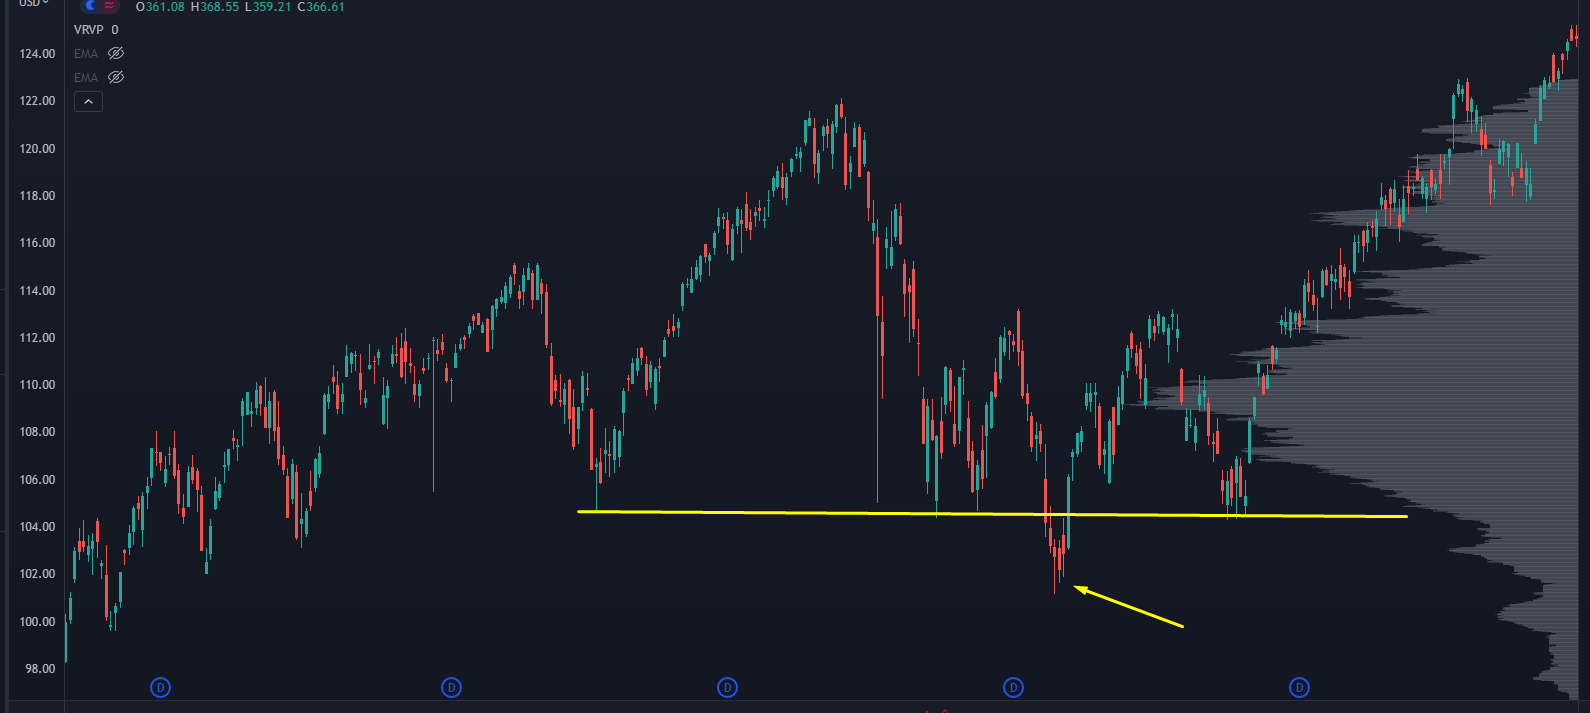
2010 Post Flash Crash Chart
Right now, we don’t know exactly where things will head…
But our Roadmap can help you spot the “Lodestone Levels” the markets will hit on either side.
Original Post Can be Found Here