The markets have suffered a lot of technical damage, and there’s always the possibility that we can rollover.
Because of all this chaos, I’ve been discussing various trading traps to avoid if you want to avoid draining your trading account.
That’s what I’ll do here.
You see, I’m guessing more traders are looking for a short setup now than at any other time this year…
Because now we are approaching some obvious levels.
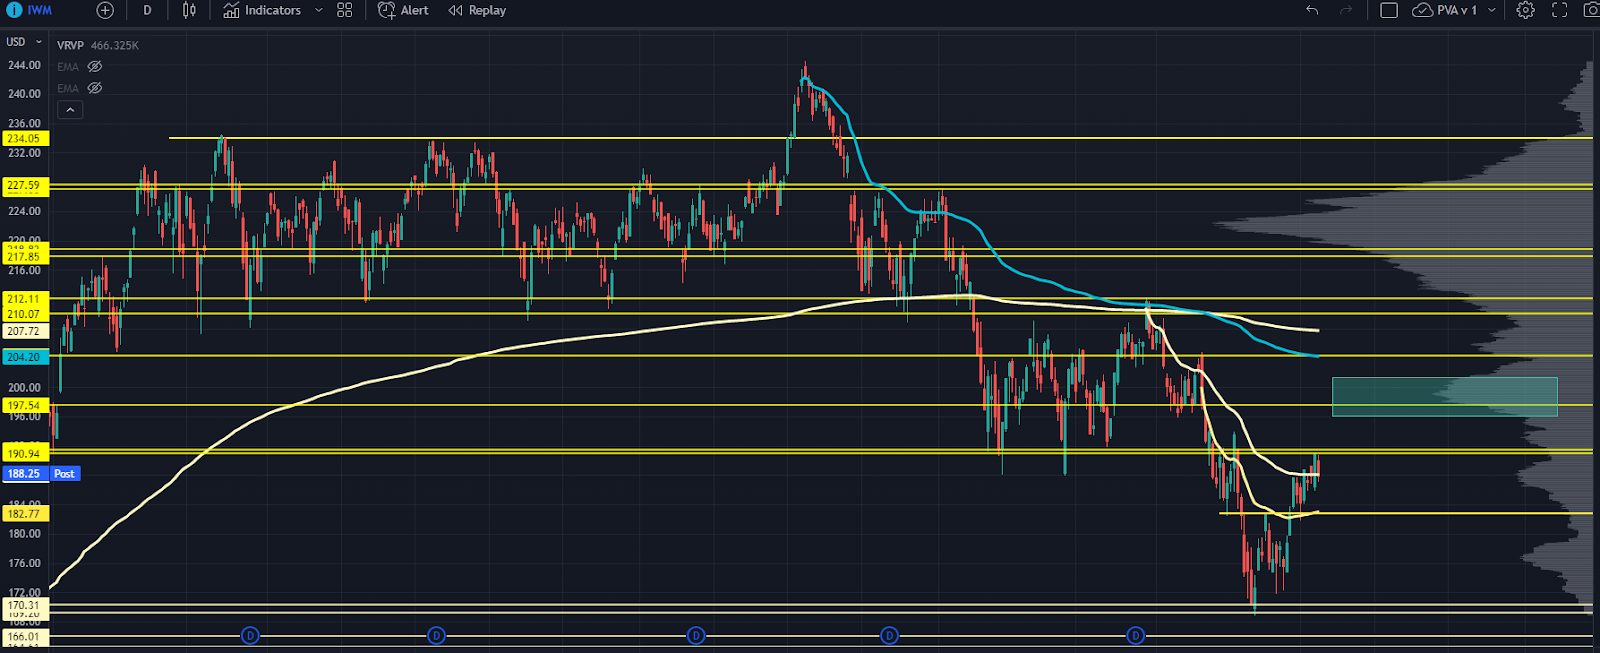
Let’s take a look at the Russell 2000:

Russell 2000 Chart
We had a very clear breakdown in smallcaps that took the index all the way back to the 2018 - 2020 resistance levels. We’ve seen a strong bounce, and now we are hitting the “obvious” prior support.
It’s always possible that this level holds as it is a key low volume node (LVN)… but I think we can push a little higher.
Why?
Because when you want to short retracements, you have to ask yourself where the trapped owners are.
That’s what a high volume node (HVN) will show you. The next one above here will be at 197.
If we hit that level, a lot of owners in this market will want to get out at breakeven.
After all, the index moved 14% move against them…
If you’ve ever taken serious heat on a position, you know that your behavior changes when you get back to flat.
Keep an eye on the Russell.
If this “obvious” level just ends up with too many shorts leaning into it, we could see one more push that’ll stop out the early shorts, forcing them to buy when many will have an incentive to sell at that level.
Also, if you want the ability to spot these levels and plan out your next move in the market…
Watch this free training on our Market Roadmap.
Original Post Can be Found Here