One way to find a high-probability trade is to view multiple assets at the same time.
I want to show you by using a trade that PVA members are still in – a long in SOXL.
SOXL is the 3x leveraged long ETF for the semiconductor industry. Many don’t like leveraged ETFs, but I love them as a trading vehicle.
When you trade a leveraged ETF, you must make sure you’re trading based on the price of the non-leveraged index.
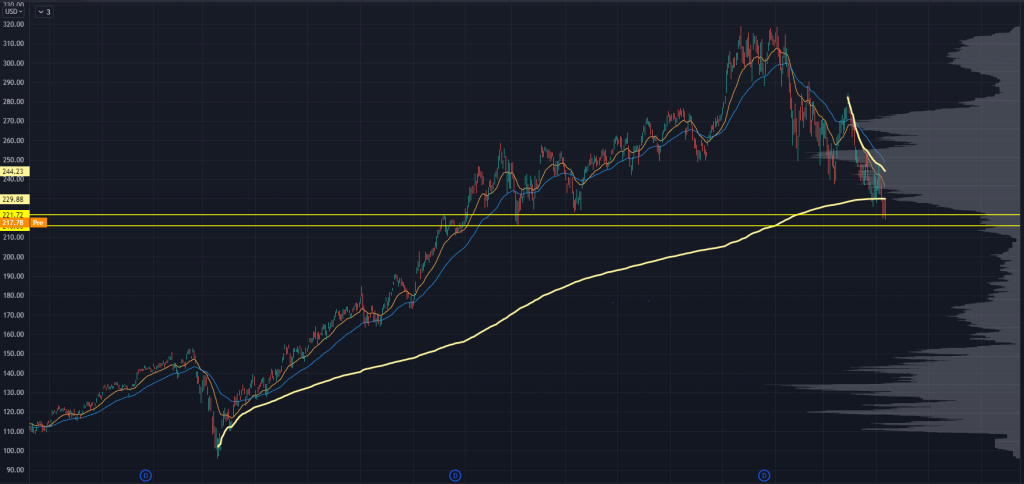
In our case, it’s SMH:
SMH Chart
We were watching SMH as it broke the swing Anchored Volume Weighted Average Price (AVWAP) from March 2020.
We weren’t expecting a huge crash – more like a “stop run” down to lower levels just underneath.
That wasn’t enough. We did a “deep dive” into the index components to see if the trade made sense.
Remember: many indices are “market-cap” weighted, meaning certain stocks will move the index more than others.
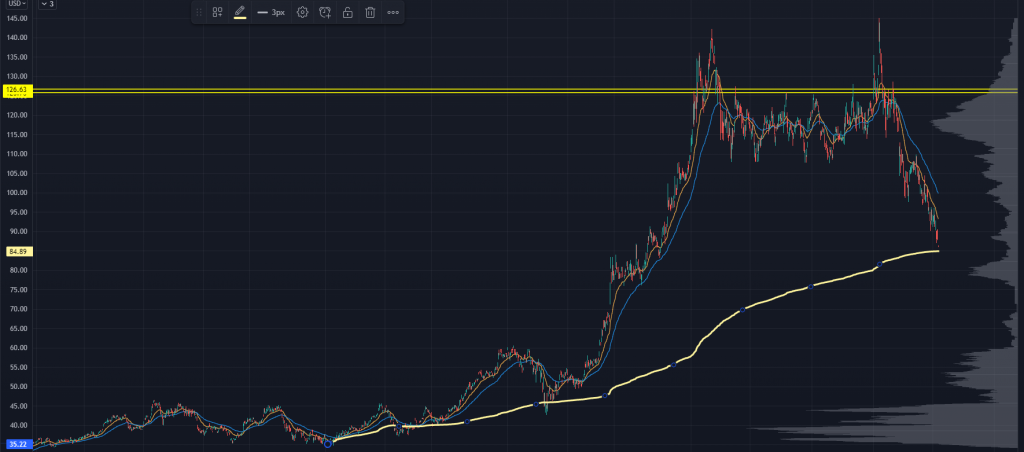
In this case, it’s Taiwan Semiconductor (TSM), which is 10% of SMH’s holdings:
TSM Chart
It had the swing AVWAP from multi-year lows, and just underneath was the only high volume node (HVN) from the 2021 trading range.
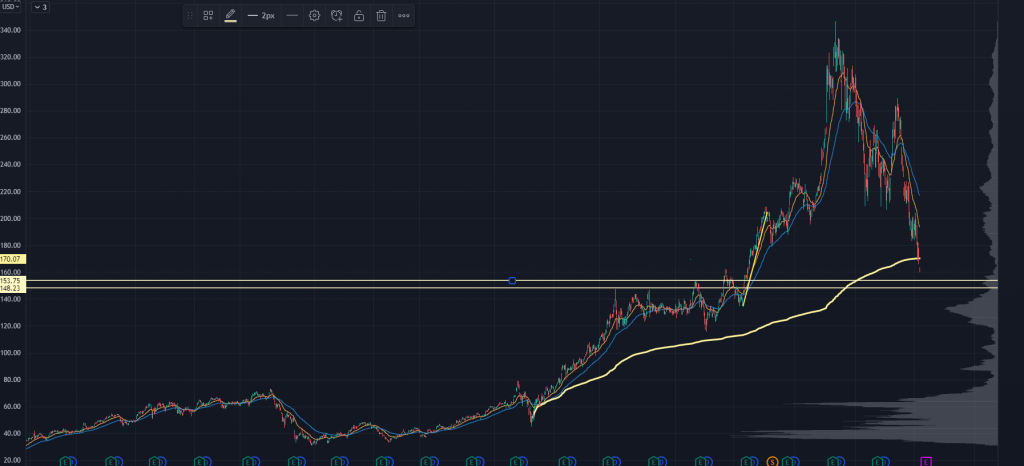
What about NVDA, which has an 8% weighting?
NVDA Chart
Right into the March 2020 AVWAP, with a potential “lower low” into the prior resistance from the 2020 range.
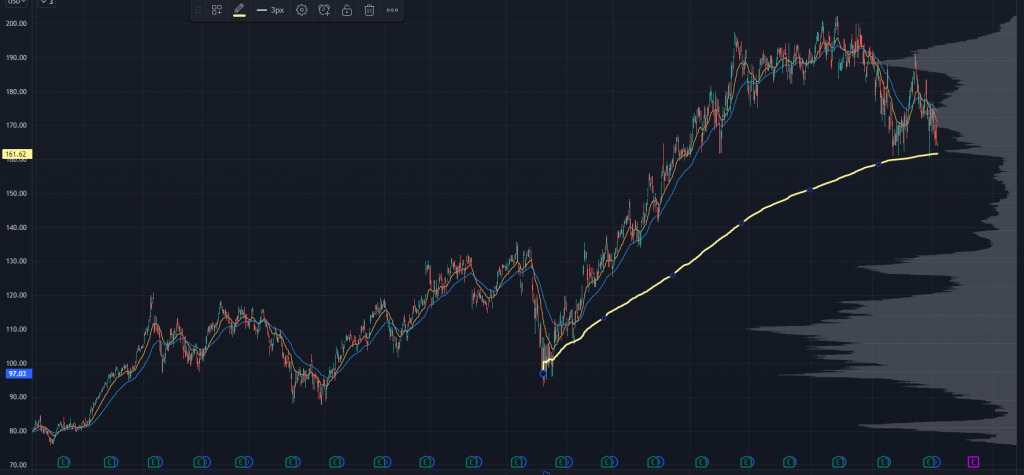
And then there was TXN, with 5% of the weighting:
TXN Chart
Swing AVWAP from March 2020 lows and the key support and volume shelf right at that price.
Those three names represent nearly a quarter of this semiconductor ETF’s movement.
When they all line up like that, you’ve got a high-odds bet to the upside.
The wild thing was NVDA reported earnings last week. They were good but had a few bits of bad news sprinkled in.
If they had reported a few weeks earlier, the stock probably would’ve been demolished. Funds were throwing out any tech stocks that weren’t reporting perfect numbers.
But we were on the tail-end of earnings season, tech had already deleveraged hard, and NVDA was heading into a massive level.
That’s how a stock can rally hard on “bad” earnings, and the semiconductor space can go through a big bounce:
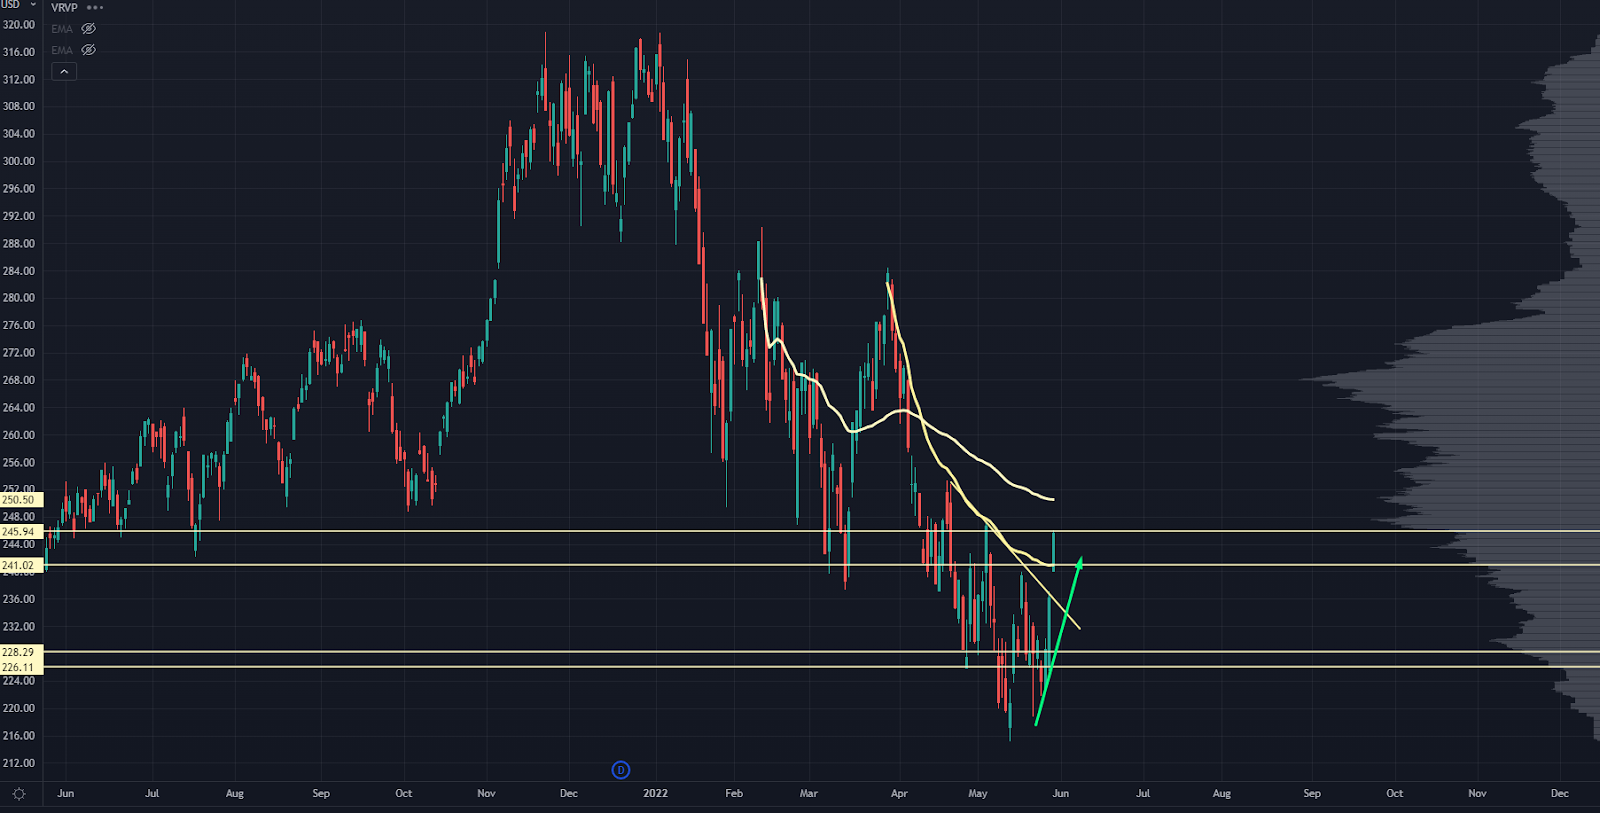
Stock Chart
We’ve already taken half our position off for nice profits and will be bailing on the rest as it comes into some of our key levels.
This is where our Roadmap can really come in handy.
It can help us find all these levels across stocks within a sector… and if they all line up like I laid out above, everything could bounce and create huge profit potential.
Learn more about using our Roadmap in this free presentation.
Original Post Can be Found Here