Before we get into the meat of this week’s Market Primer, a quick heads up:
Last week, I held a free class discussing key market-moving events happening now — including inflation and war — and how to trade them going forward.
If you want to get ahead of inflation and gain some peace of mind in the coming months, I highly recommend you check out this free training ASAP.

SPY Chart
Last week, I wrote:
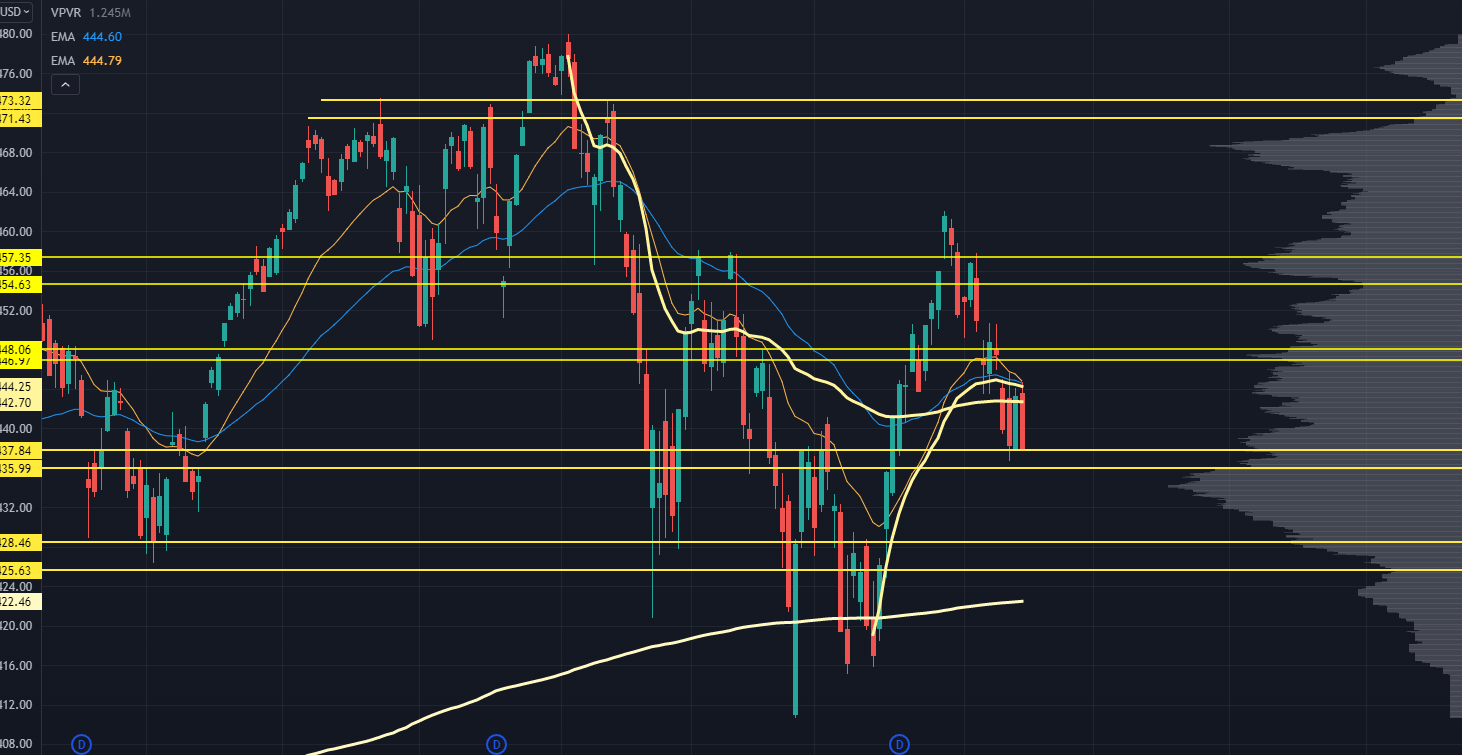
“A break under last week's lows and our next pivot level is the 435-437 area. Yes — it’s an internal pivot point. But you should see some key rebalancing in the market at that point.”
That’s exactly what happened.
The market was soft heading into Tuesday’s key CPI number, and it traded into that 435-437 zone. That zone has held for a few days.
We're starting to see more deterioration beneath the surface. Banks are getting clobbered as names like JPM and GS report earnings.
Semiconductors are already at new lows for the year, and beaten-down sectors like biotech and high-beta tech just can't catch a bid.
This is truly "no man's land" in terms of what happens next. We just have to be highly observant of the price action we see over the next few weeks.
For example:
The obvious bearish setup would be a clean break of this week's lows, followed by a swift move to 425-428.
This move is possible, but we could just as easily break down without any follow-through, leading to an attempt at the most recent highs.
So the crystal ball is fuzzy in terms of the outcome, but it should dictate which side of the range we are going to push into.
If we lose 435 and see proper follow-through, then yes: 425-428 is the next level to grab.
But if the breakdown fails, look to how the market acts when it comes back into the monster level that lined up with Friday's high: the 20 and 50 EMA, along with the Anchored Volume Weighted Average Price (AVWAP) from the March pivot lows.
We could see a fast short cover rally into 447 if we get above that.

QQQ Chart
Is this another instance where we have to “shoot the generals” to reset the market?
Large-cap tech has traded awfully heavy — in part from the continued inflation risk as it pertains to flows into names like AAPL and MSFT.
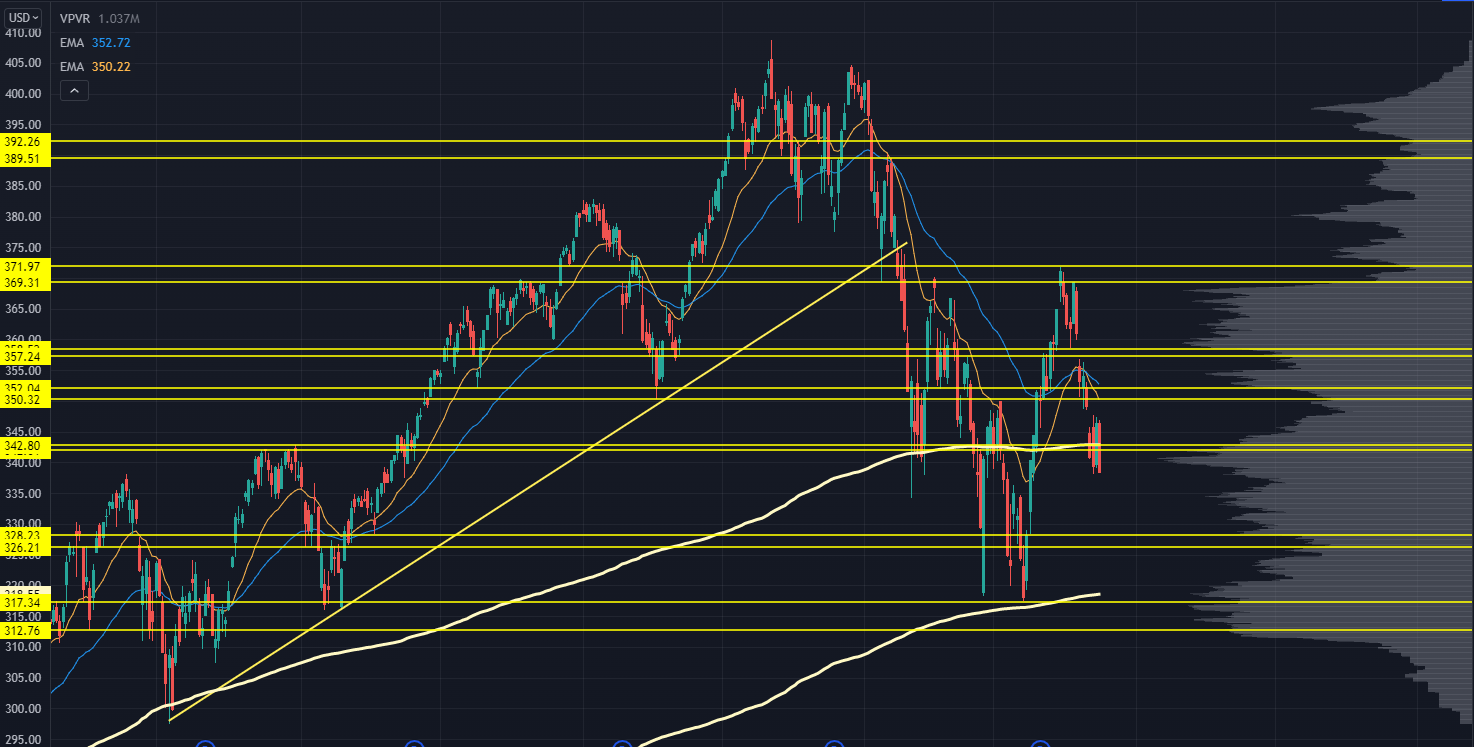
Our level at 342 isn't being particularly respected. But if you see how it acted during the first pullback in January, it's not surprising to see more aggressive probes into that level.
We’ve started to see more volume build out in that low volume area between 342 and 350, so we will need to adjust our Roadmap soon.
Underneath the current price, we've got a sneaky Low Volume Node (LVN) at 337. I'd round down to 335 since we've seen prior price responses against that.
If we lose that level, then expect 326.328.
To the upside, we have the week’s highs that coincide with a key LVN, and a gap fill just above that.
The past 2 weeks have trapped plenty of inventory... so unless something wild comes out of tech earnings, we shouldn’t expect a massive rip off of those levels.
A more bullish scenario would be a bounce with prices actually being accepted and then holding at higher levels.

IWM Chart
The Russell’s seen some slight relative strength since the Monday selloff wasn't as hard relative to last week's prices.
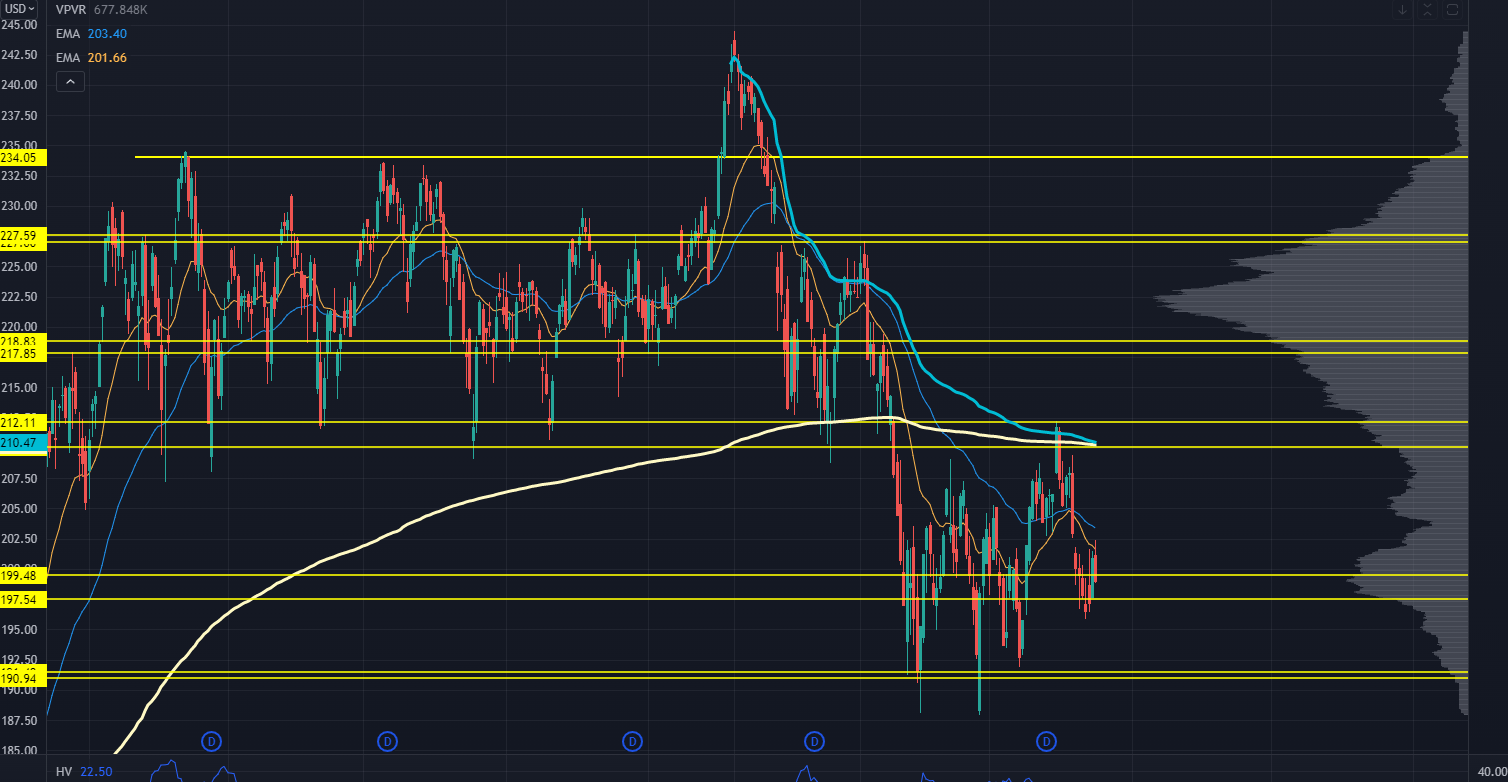
Other than that, we're seeing continued failed auctions higher any time the index has attempted to rally. It did finish higher on the week, but that could just be because the index has better exposure to the energy and "inflation" trade vs. large-cap tech.
To the downside, we have the year's lows, and under that…
I have no idea.
We didn't see a lot of trading happen during the post-election rally in 2020, so I don't know how deep we would back and fill if the market did lose its lows.
To the upside, we have the gap fill and Friday's high as a clean reference point. Then, there’s the 207.50 level as internal resistance, which should allow the swing AVWAPs to catch up to price.

VIX Chart
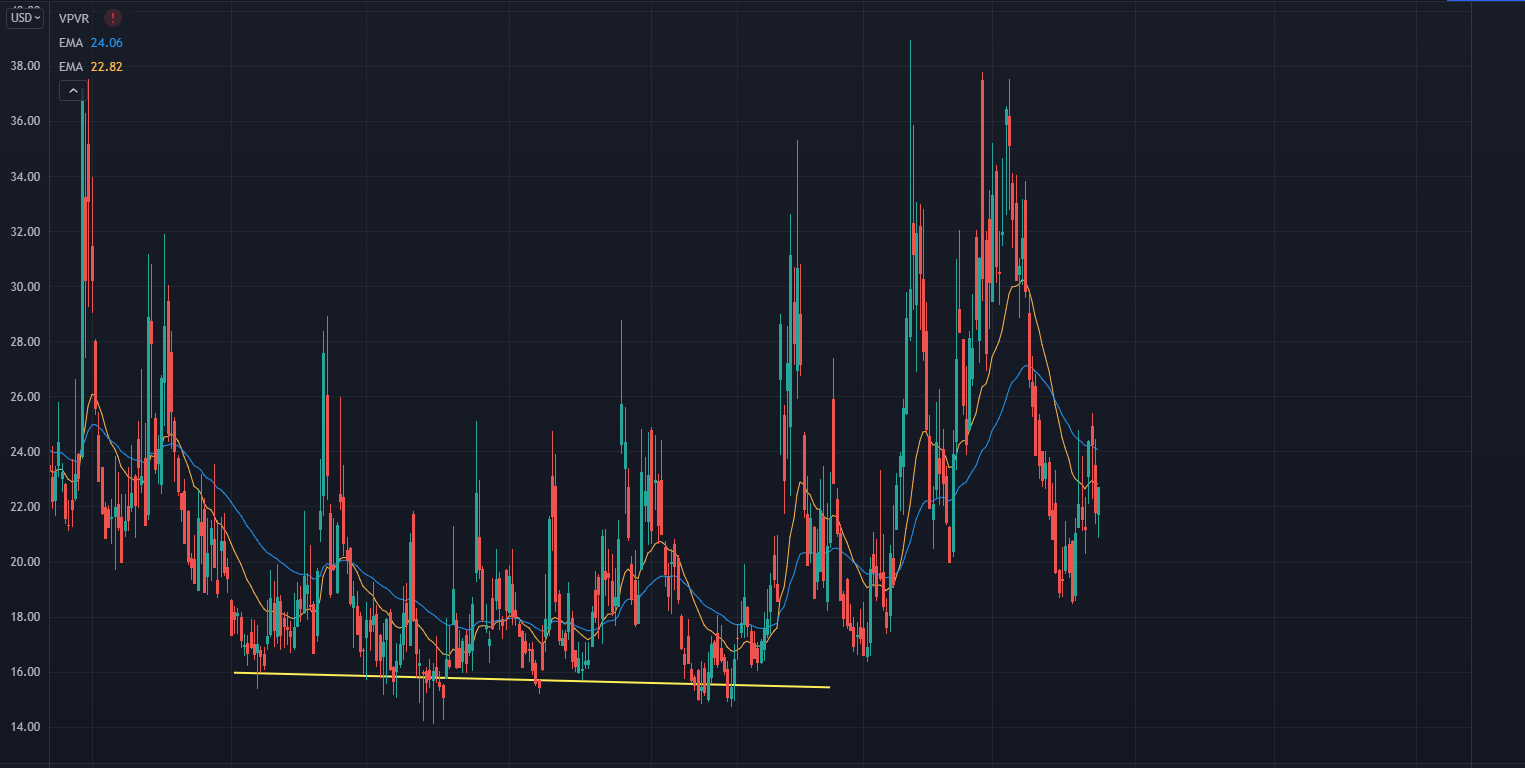
One interesting quirk about the VIX is how it will underperform into a 3-day weekend.
Market makers will start dropping the SPX options market premia to start pricing in a long weekend…
And that’s how you get spot VIX trading lower relative to the magnitude of the S&P selloff.
It's clear much of the equities rally was based on flows instead of a change in the expected risk of the markets.
That's why, once VIX cracked 30 and made the move to 20, we saw such a strong rally in stocks.
I would keep an eye on how the VIX trades into any further market weakness. If we don’t see a huge rip higher, that signals liquidity is improving, and the institutions aren't freaking out about further downside.
To clarify:
With any divergence between SPX and VIX, the "smart money" will be on the VIX move.
That’s all for this week’s Market Primer. To learn more about the Trading Roadmap I use to pick apart each index and predict where they could go:
Original Post Can be Found Here