I think it's fair to say that the "inflation trade" is now out in the open.
Within a few months, we saw a pivot from "it's transitory" to food riots in multiple countries.
And you know what?
It seems to be getting worse.
We've got hilariously large lockdowns in Shanghai, which could lead to a serious supply chain cascade.
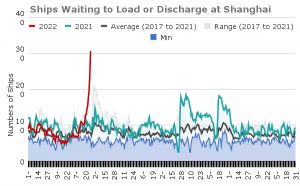
Ships waiting to load or discharge at Shanghai
We’ve also natural gas prices, which went on a massive run above $7:
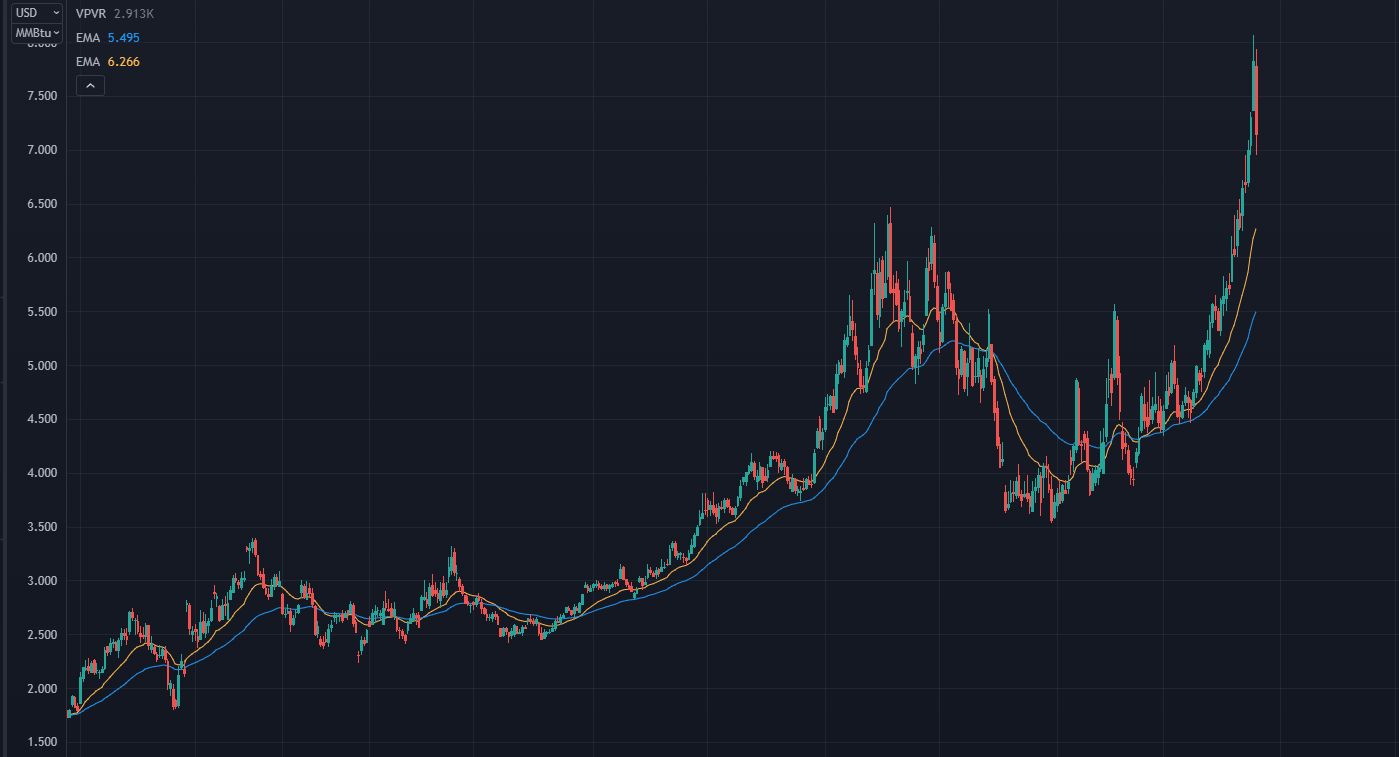
Natural Gas Prices Chart
And now, the 10-year yield is close to hitting 3%:
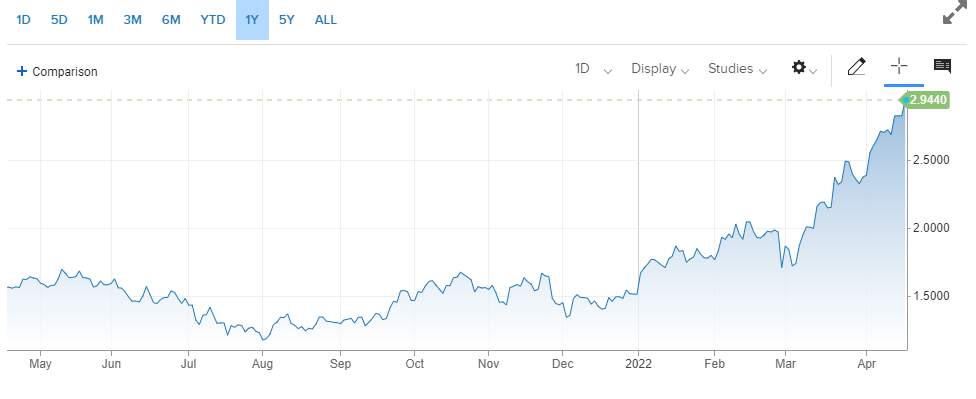
Natural Gas 10 year yield Chart
I think it's safe to say the cat’s out of the bag.
When a market narrative starts attracting too many eyeballs, I start to wonder...
Where could it be wrong?
So a week ago, I started hunting down the possibility of deflation. Nobody wants to think about it. Nobody thinks it will happen. But what if we at least see a hard pullback?
I'll show you the industry I'm watching, but first:
Let's think about this inflationary cycle’s timing.
US midterm elections are in about half a year from now, and one of the main concerns among voters is the rising cost of goods.
The administration can blame Russia all they like…
But we've all seen the backlogged ports on the West Coast, the prices at the pump, and the current admin’s continued negligence and inability to fix anything.
I won't be shocked if there's an attempt to break the inflation trade as we head into the summer. Maybe some kind of resolution in Eastern Europe that creates a massive deleveraging of commodity longs.
All that said, the sector I'm watching is not directly tied to energy or agricultural products...
It's the semiconductor space.
Instead of seeing a shortage, we could be seeing a "glut!"
This blows my mind. Web3 and AI have caused MASSIVE chip demand. We've also been hearing about how automakers can’t make cars because they can't source semiconductors.
The issue is that in the next year or so, a ton of production will come online. Nearly half a trillion dollars (Yes. Trillion. With a T) is being invested in factories and other facilities.
I think this story is the one to watch into the end of the year because the price action of SMH, the semiconductor ETF, reflects it.
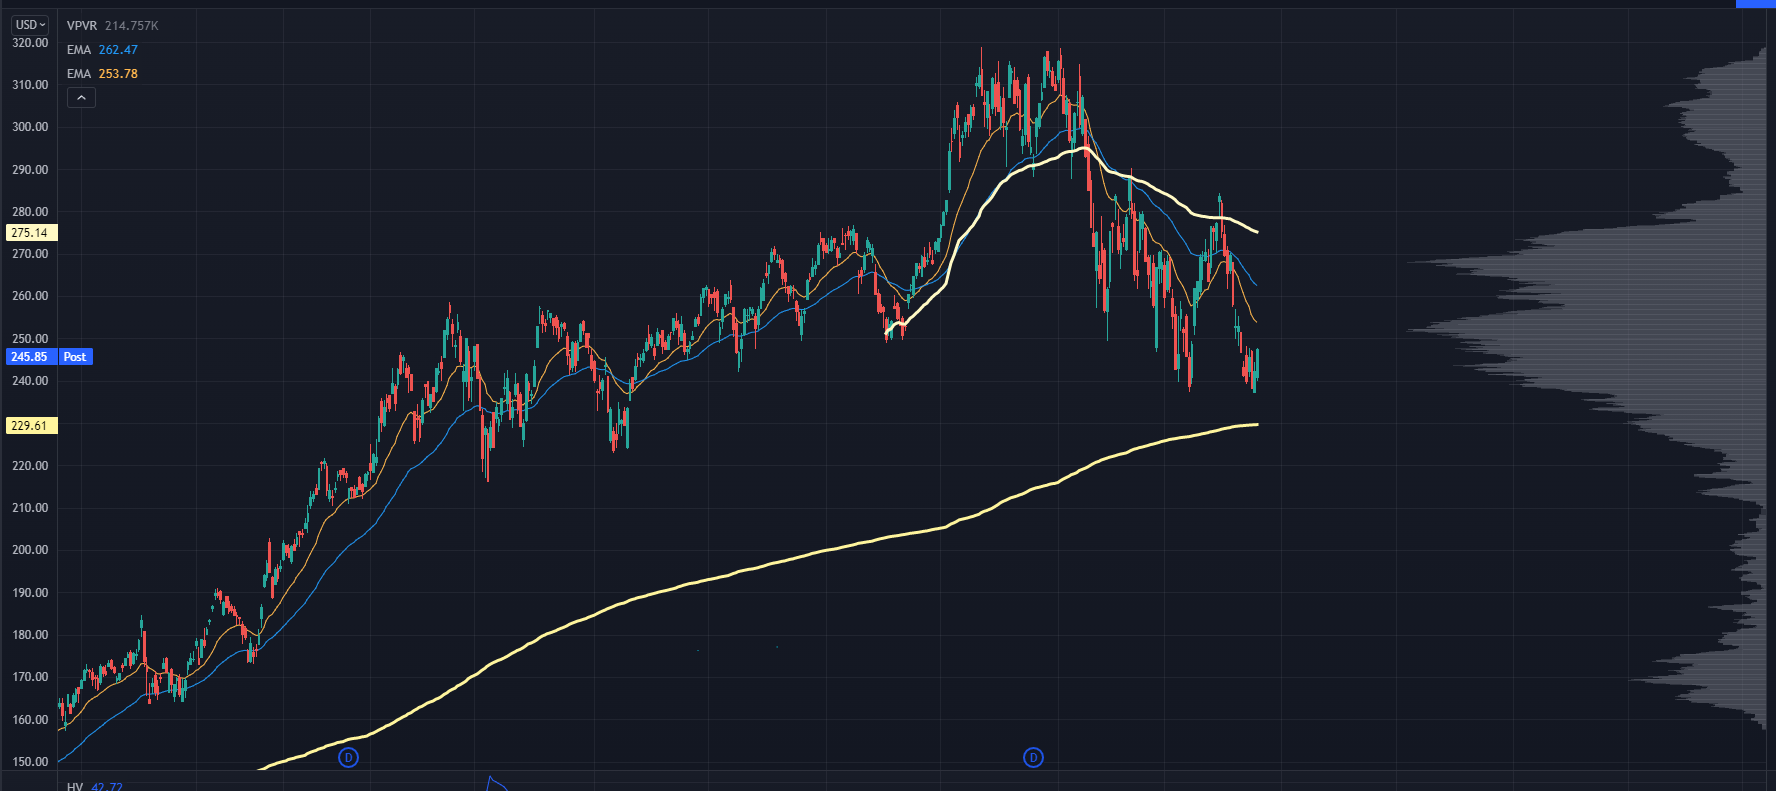
SMH Chart
While the Nasdaq made a higher low relative to its March lows, the semis already retested their level.
We can easily make the case for a year-long distribution in this sector. Yesterday's prices were first touched in January 2021, and the average buyer is currently down 6%.
Are enthusiastic buyers not showing up because chip supply is on the verge of skyrocketing?
It's a great story, but the main thing to watch is our Trading Roadmap:
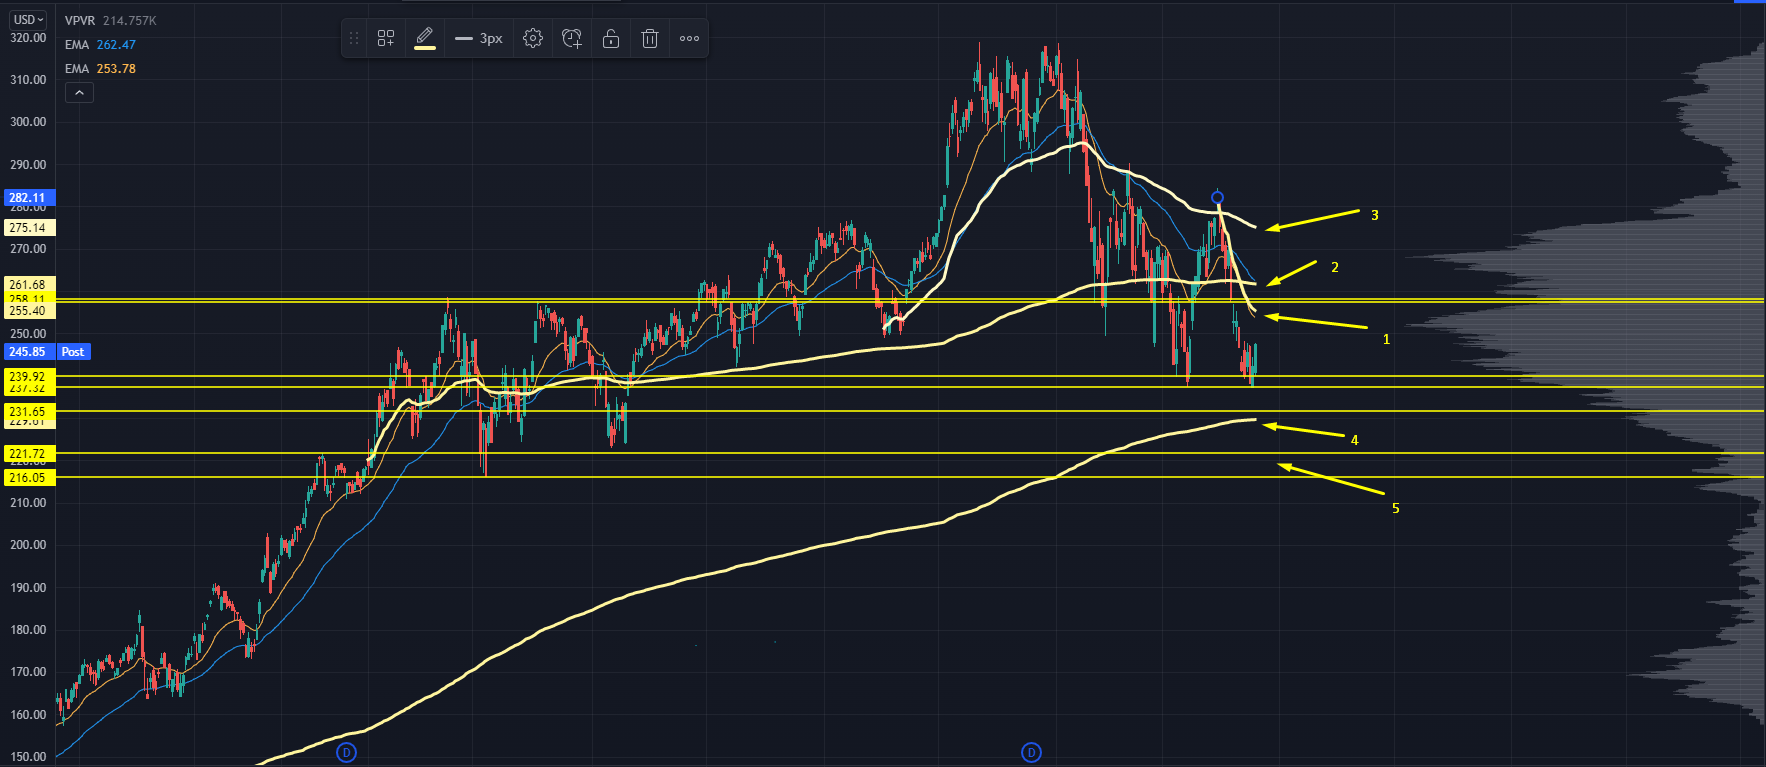
SMH Chart with Price Levels
The zone I'm most interested in on SMH is the first one. If we get a good bounce, price could run up into the Anchored Volume Weighted Average Price (AVWAP) from the recent highs, the 20 EMA, and prior price responses. If we find hard sellers there, then we can easily break the recent lows.
If we see a push above that, the next area will be the AVWAP from the start of 2021 trading, which also aligns with the 50 EMA.
If those drift down over time, they could line up with the key low volume node (LVN) at 258, which would be a great shorting area if you think we can really roll over.
The final one to watch is the AVWAP from the Oct 2021 lows. This has been a very responsive area and was right around the ETF’s key pivots that have happened since December.
To the downside, we could see a sneaky "failed breakdown" where SMH takes out the recent lows but comes into a LVN and the AVWAP from the March 2020 lows. This is a HUGE level to watch.
Below that, we have the 216-221 zone. It’s wide, but if we get to that level quickly, I’d expect volatility to pick up.
This would be a good place to cover some longer-term shorts in the sector if you had them on. If we got there quickly, it would make sense to play long calls for the quick short back to the 230s.
Speaking of this Trading Roadmap that pointed out all these levels:
This training will teach you how it works… and how to put this powerful tool to work for you.
Original Post Can be Found Here