The non-stop chatter on financial media isn’t about the next round of iPhone sales…
Or whatever clever quip Warren Buffett will come up with.
It’s bonds.
That’s it. Everything in the economy is running downstream from how long the Fed is going to keep rates high.
There absolutely will be some pain in the markets from this decision… but it doesn’t have to happen immediately.
Remember, the housing bubble started in 2006 but didn’t completely wash out until 2011.
There is, however, a much shorter term ‘convexity’ event that has traders worried.
If you get enough people on the wrong side of the “long bond” trade, it can trigger a massive unwind.
I don’t think it will happen, and I can show my work in a moment… but first consider some of the implications.
When Softbank went down, part of the reason was that they were holding fixed rate assets at a very low rate.
Think mortgage backed securities (MBS) and treasuries (UST).
And to be honest, there’s a lot of institutional capital stuck in these trades.
Because these are “stable” assets, pension funds don’t have to worry about mark to market accounting since they can just take the 1% returns and, eventually, the debt rolls off their books.
But if they had to — I mean absolutely HAD to sell right now…
It would be a bloodbath. We’re talking 40% writedowns on US Treasuries.
That’s where it could get ugly.
But NOT YET.
In fact, we are coming into an area that has massive long term implications.
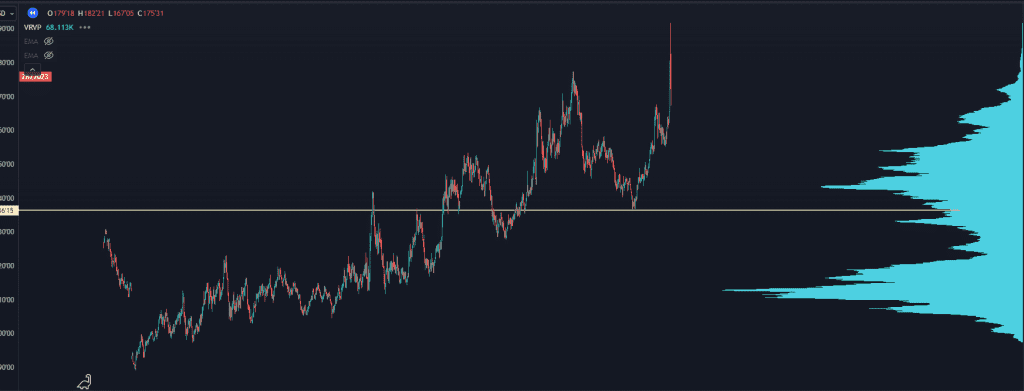
Here is a weekly chart of ZB, the futures market for the long term treasury:
Chart
This was right when the Treasury market broke in March 2020.
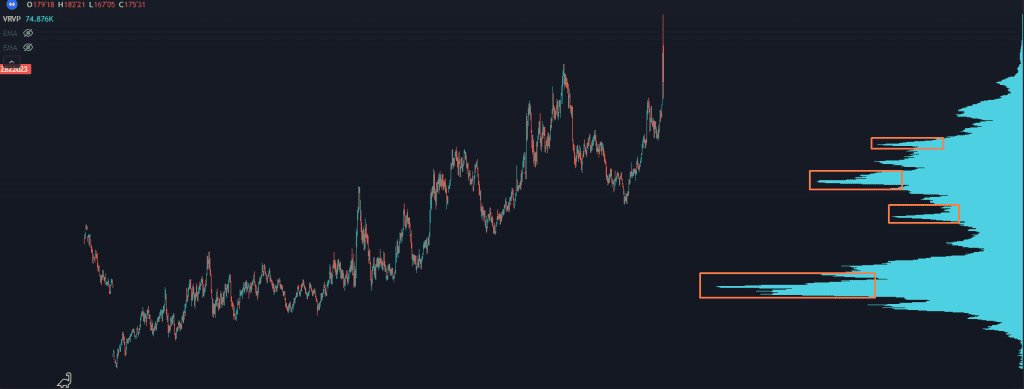
On this chart there are levels that act like magnets– they tend to be where the most liquidity sits.
Do you see where they are?
Chart
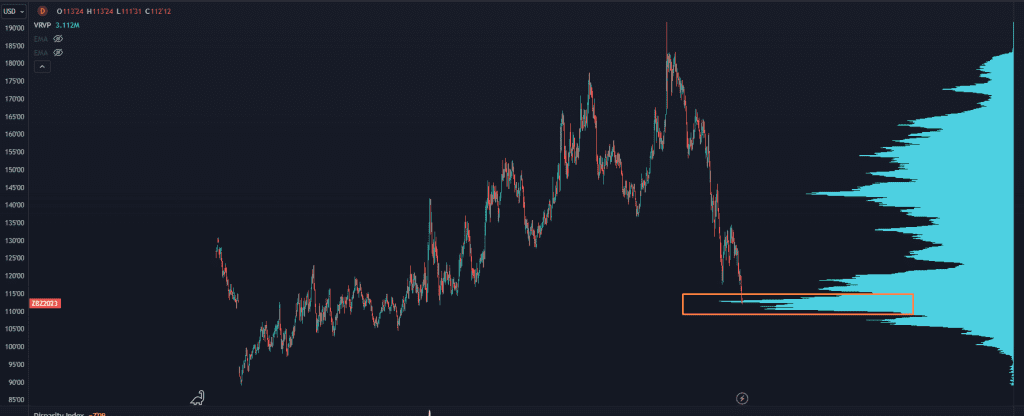
The biggest area of liquidity is down at 110– which would be a 40% drop from these highs– something that should not happen in the treasury market.
But it has.
Chart
Price coming into this liquidity zone is a huge decision point for the bond market, and it could be the best buying opportunity in Treasuries that we’ll see in years.
Of course there’s always the possibility that the entire treasury complex falls apart– but if we do enter some kind of a risk-off environment, what do investors do?
They sell risk, and buy treasuries.
I think we’re getting to an inflection point where the downside momentum will cool off and we will see a decent bounce here.
We may not be there yet – it could require a push through this liquidity zone:
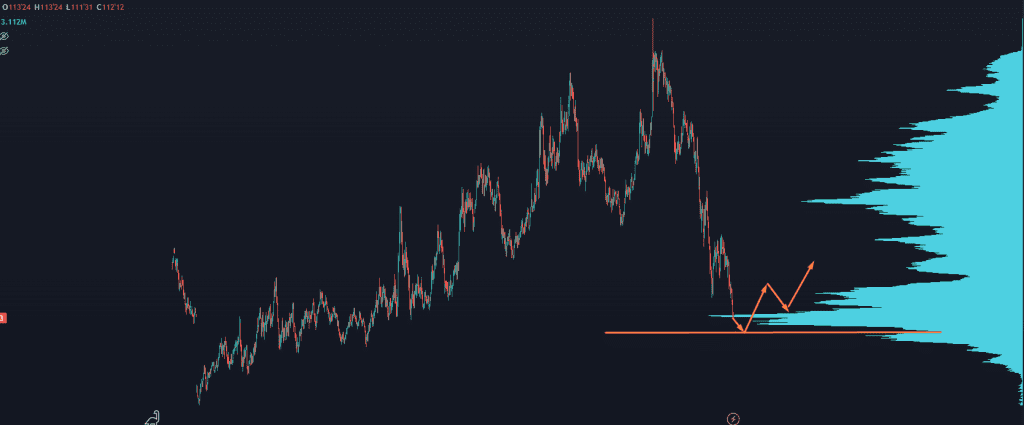
Chart Bond
If you want to have a good feel for how this can play out, take a look at how the bear market ended in NVDA in 2022:
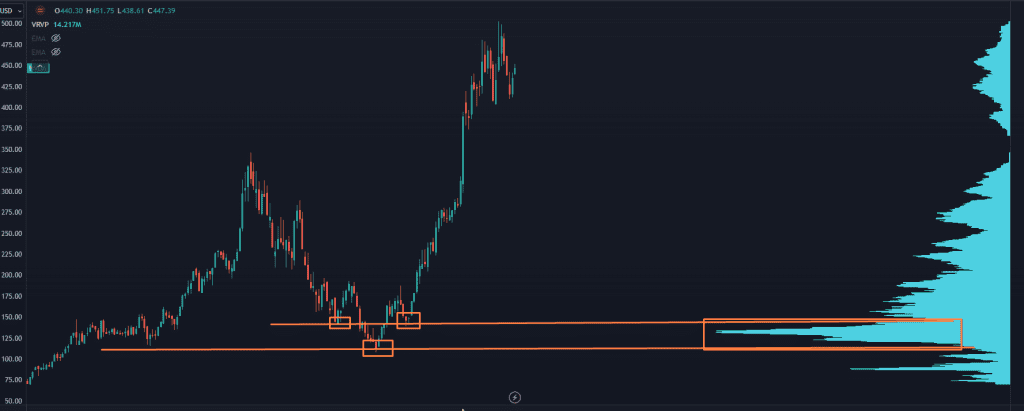
Chart Bond
Now’s the time to start paying attention to a possible hard reversal in the bond market.
For my paid readers and I, that means paying attention to these liquidity zones you see on the charts above.
They’re part of the same strategy I used to call the bottom of the covid selloff to the day…
Click here and I’ll walk you through the whole thing in a free training video.
Original Post Can be Found Here