Even large institutional players like Brigdewater were pushed to the sidelines in 2022. But now, they’re eager to make up for losses, and you can profit from that desperation.
Just look at how desperate they are to make up for missed opportunities last year.

Chart Capital Gains from Institutional Desperation
As such, institutional capital started piling back into the market, ready for the next move.
It was another 18% higher before sellers started to show up…
And now, even with everyone saying the market is due for an exhale…
There’s still plenty of institutional capital that has not just FOMO, but remorse for not buying the dip when tech stocks like META fell below $100 during the recent tech bust.
With that in mind, I’m betting this dip will be bought but it won’t be easy.
Hedge funds will try and rattle retail traders, pull bids and jam stocks to better prices.
Still, you can gain an edge with a liquidity concept that’s guided our trades for 13 years.
Let me explain.
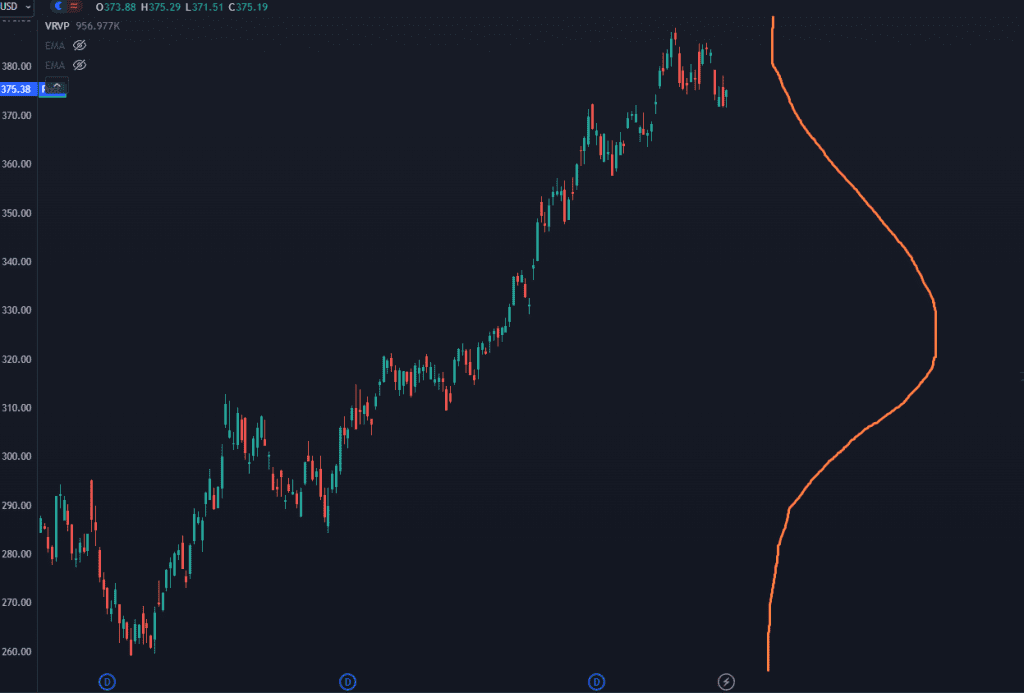
In an ideal world, trading volume should look like this:

Chart Capital Gains from Institutional Desperation
This is called a “Normal” or “Gaussian” distribution.
And it says that under normal circumstances you should have…
Fewer buyers at higher prices and fewer sellers at lower prices.
Sound logic.
But that’s not how liquidity works in the real market after a Fed decision.

Chart Capital Gains from Institutional Desperation
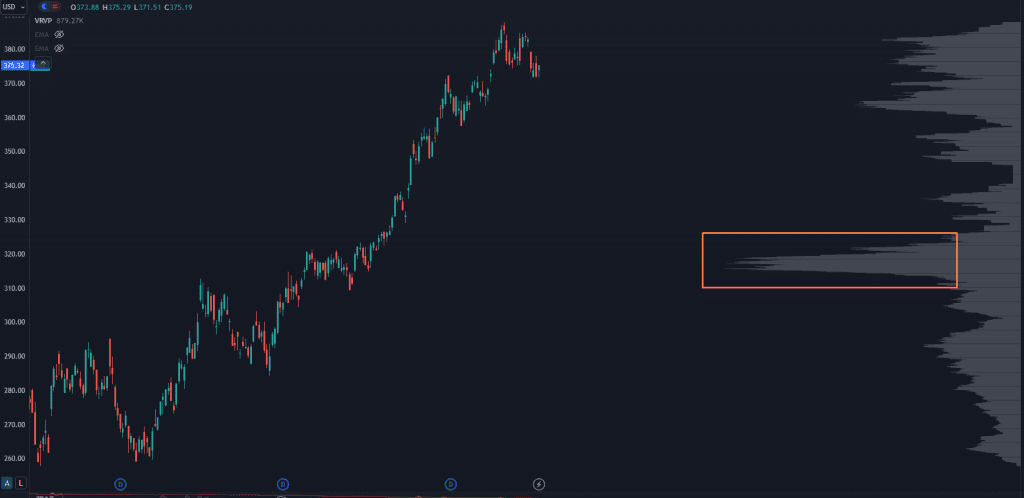
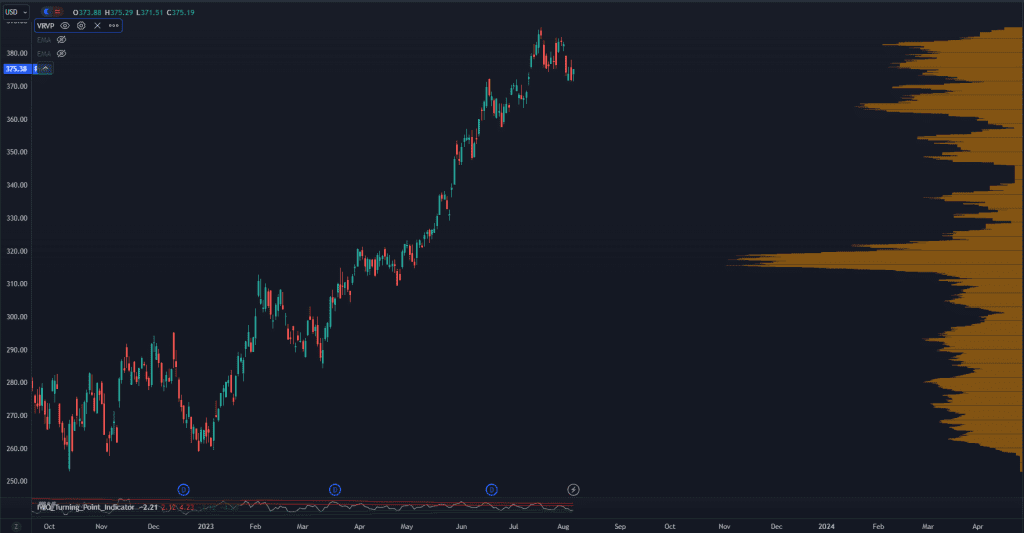
The difference is the volume you see building out to your right…
It’s almost the exact opposite ot the Gaussian distribution…
(More institutional buyers at higher prices, and fewer sellers at lower prices).
Clearly a vast departure from what’s ideal, but that’s where you gain a significant edge by asking what the liquidity level says about what institutional players will do next.
That’s an advantage we don’t take lightly because once you know what they’ll do next…
What price levels they’re eyeballing and when they’ll pull the trigger…
You can structure your trades to leverage price movements relative to institutional flow.
It’s actually more fund and straightforward when you do this on screen.
And I shared more insight in a free video training for retail traders ready to make the leap to bigger profit zones this earnings season, without taking unnecessary risks.
Watch it here to see how we turn institutional desperation into capital gains.
Original Post Can be Found Here