If you’re old enough, you might remember David Copperfield’s most famous illusion… making the Statue of Liberty disappear.
Copperfield covered up Lady Liberty under a big, red tarp… did a little dog and pony show… pulled the tarp away and… voila!
The Statue of Liberty vanished before our very eyes.
Now, what the audience didn’t know is that, while Copperfield was showboating and letting his leggy assistants prance around on stage…
The platform was all the while rotating ever so subtly away from the line of sight of the iconic statue.
It’s misdirection at its finest.
Now, the reason I bring this up is that a similar phenomenon can happen when there’s lots of noise in the markets.
Like a looming recession, a sovereign debt crisis, the threat that two behemoth banks might go belly up, or even that a little “spit in your eye” territorial conflict could catalyze full-scale nuclear war.
That’s a lot of anxiety swimming around in the pit of your stomach and misdirecting you from a burgeoning opportunity brewing right under your nose.
It’s similar to what happened after we bottomed out in 2009.
We’d just lived through this anxiety, uncertainty, and pain so investors were still antsy about the volatility being over.
I was in New York City to speak at the Nasdaq site in Times Square:

I was the young hotshot, and the other two were seasoned traders. If I recall correctly, one was a hedge fund manager and the other was a partner at a prop firm.
We were talking about the markets and where we could head next, and I made the call that one sector would start to get hot.
Sure enough it did:
One flagship ETF in the sector ran over 200% in a few years…
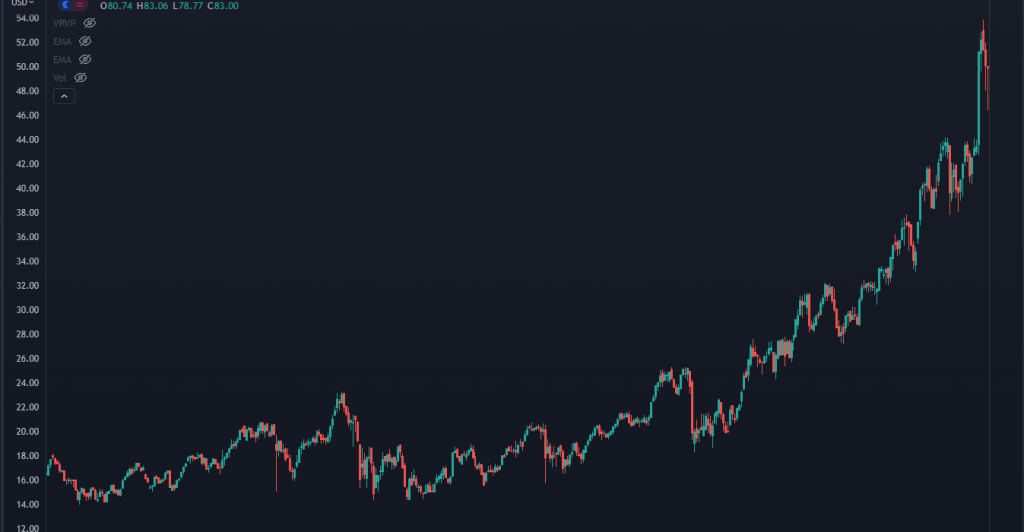
And a different ETF in the same sector ran 300%
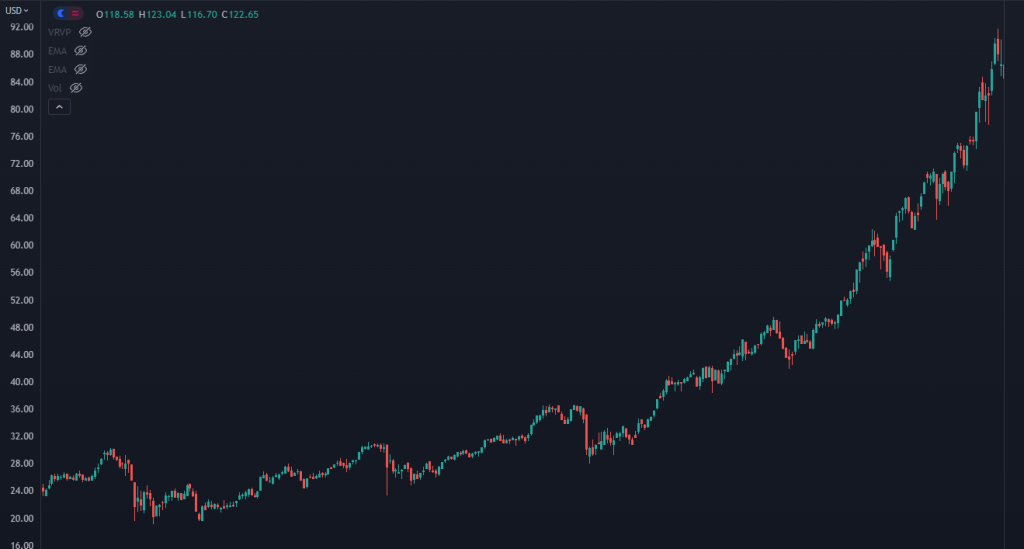
Steve Cohen of SAC capital pulled at least $100 million profits on a 10 day hold, the stock ran from 4 bucks to 45, on top of a 75% rally on the year.
Another name saw a push from 5 bucks to 75 over the course of two years.
Now everyone there was still timid of the market, and ready to make an exit if needed. But I was willing to stick my neck out and make a bold call on names that had significant upside.
I knew that everyone else was looking in another direction and missing the fact that the stage was rotating right underneath their feet.
To be fair, this bear market is nothing like the Great Financial Crisis, and there’s no guarantee that the bloodletting is done.
But, we’re seeing this sector heating up again, big time.
>>> Find “Dark Value” In This Hidden
Original Post Can be Found Here