


It’s make-or-break time for crude oil.
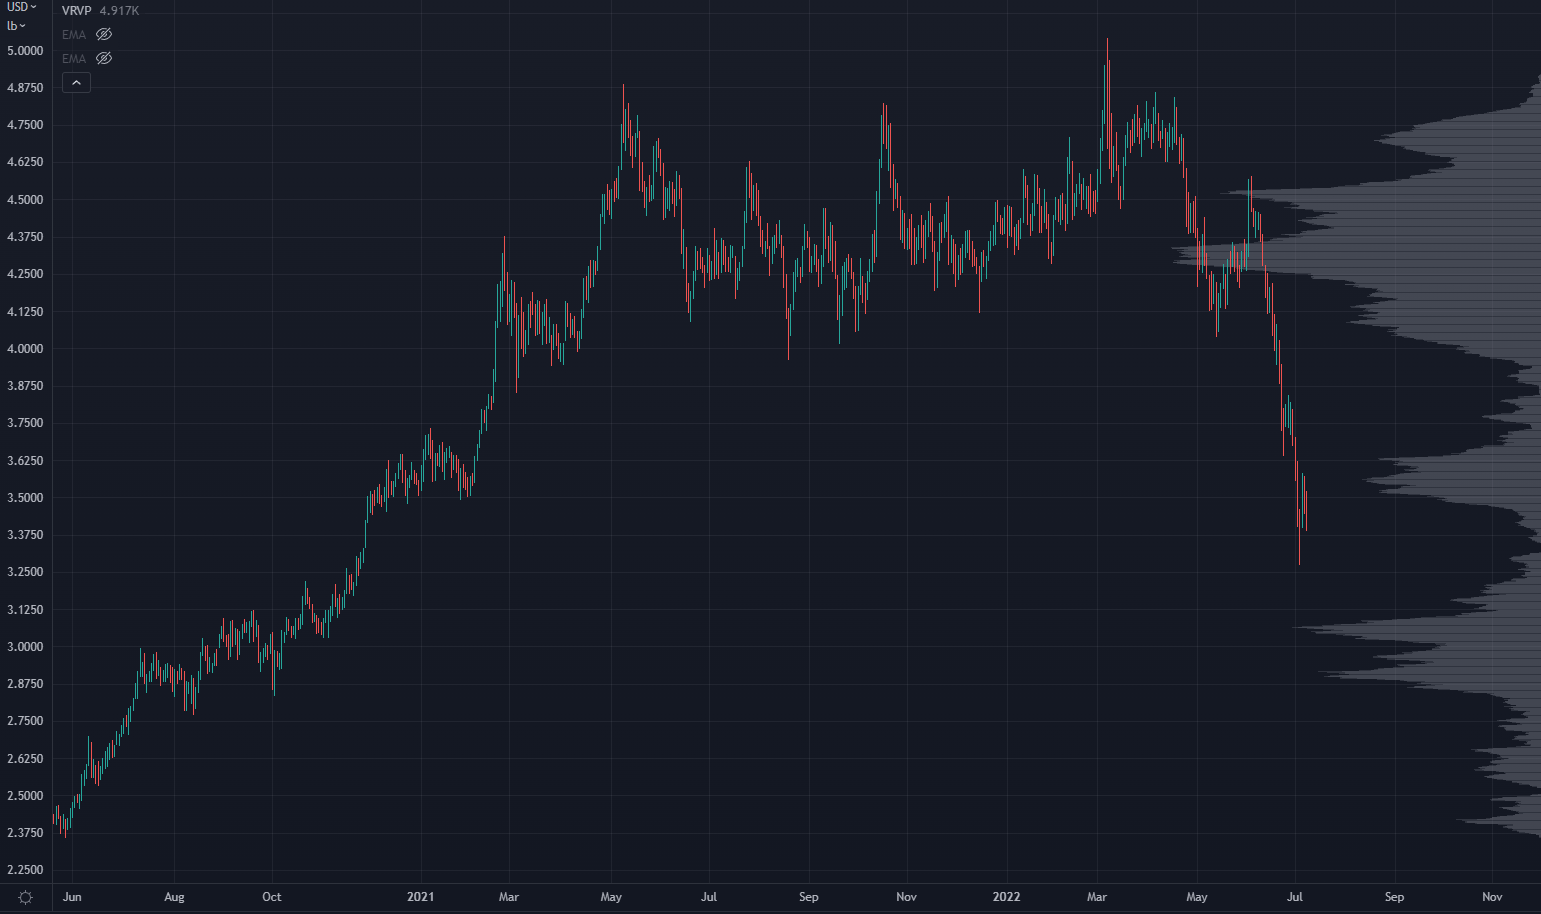
Last month, the Fed’s 75 basis point hike set off a cascade of deleveraging in commodity assets.
For example, here’s a chart of copper:
Copper Chart
The 75 bps hike, combined with Chinese deflationary risk, has caused many hot inflation sectors to run hard to the downside.
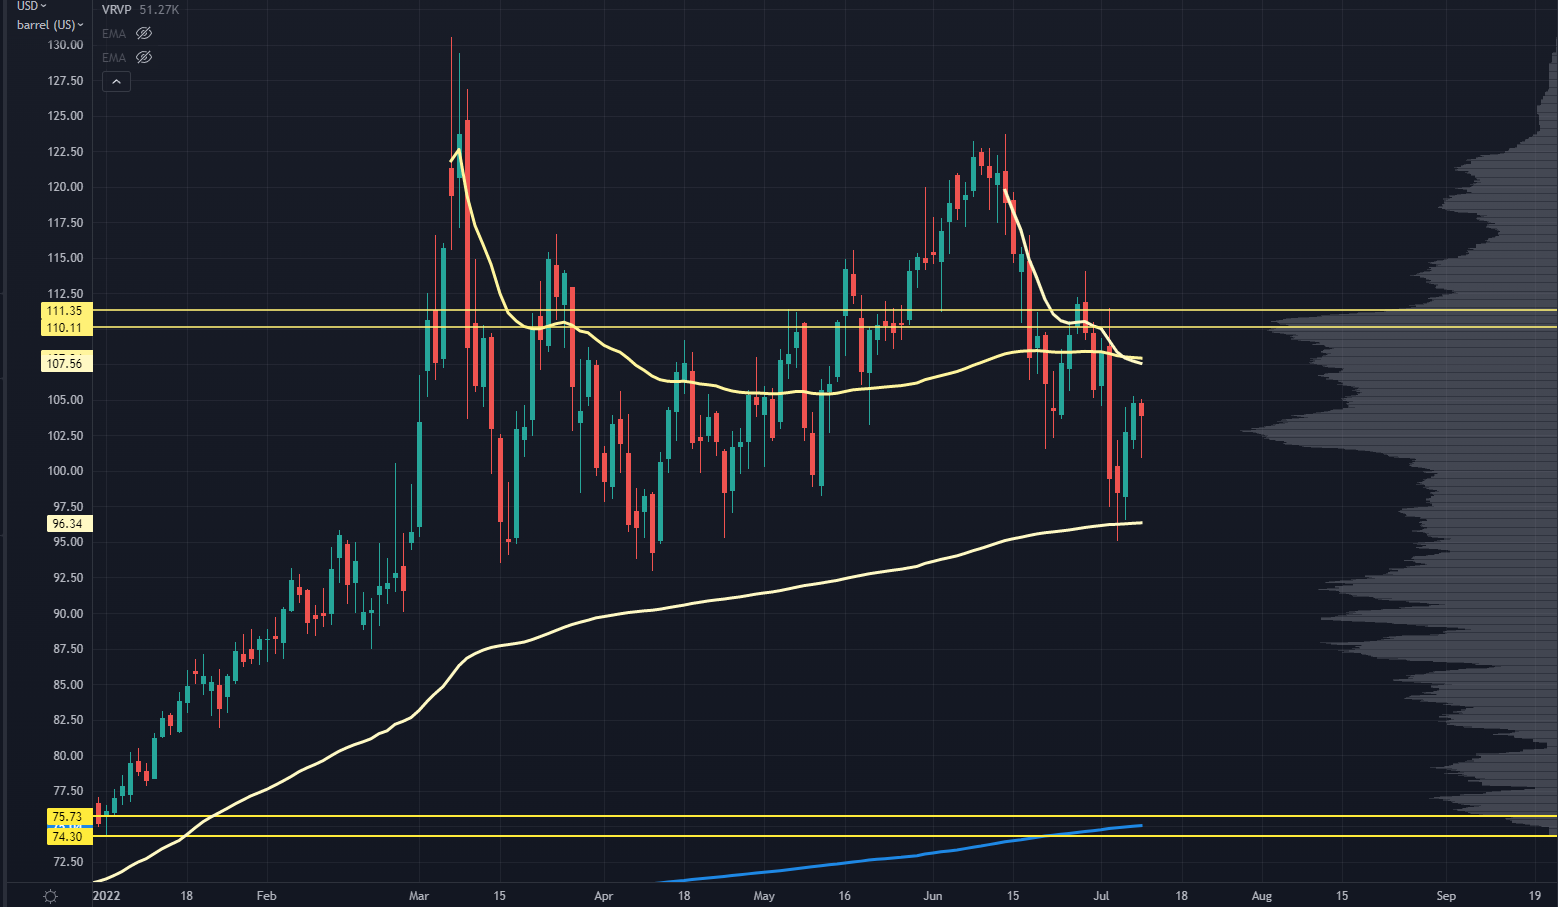
Oil is still holding up well:
Oil Chart
The market came back and successfully tested the Volume Weighted Average Price (VWAP) from the December 2021 lows…
And is now bouncing towards the middle of the range.
This is a pivotal level to see if this is a cycle high in US energy markets.
We’re watching two levels here:
If aggressive sellers show up into those levels, we could potentially see a breakdown of the recent lows.
That would make some of these oil names good for retracement shorts.
But if we break above it and hold with new buyers, that could kick off a new wave of “suck” in the markets…
Forcing the Fed to be more aggressive.
If you trade stocks, especially tech stocks, then you must have these levels lined up.
Or, you can trade oil stocks like we’re doing at Precision Volume Alerts.
I just issued a new trade on a big oil name to my Precision Volume Alerts members.
Become a member today to grab the ticker.
Original Post Can be Found Here