Let’s ignore the indices for a moment and simply consider “risk.”
This year has, in my opinion, been the primary driver behind stock market volatility.
There was money in strategies with a ton of negative convexity against them upon a significant move in rates — unbeknownst to the investors who followed them.
How has that unwind been going?
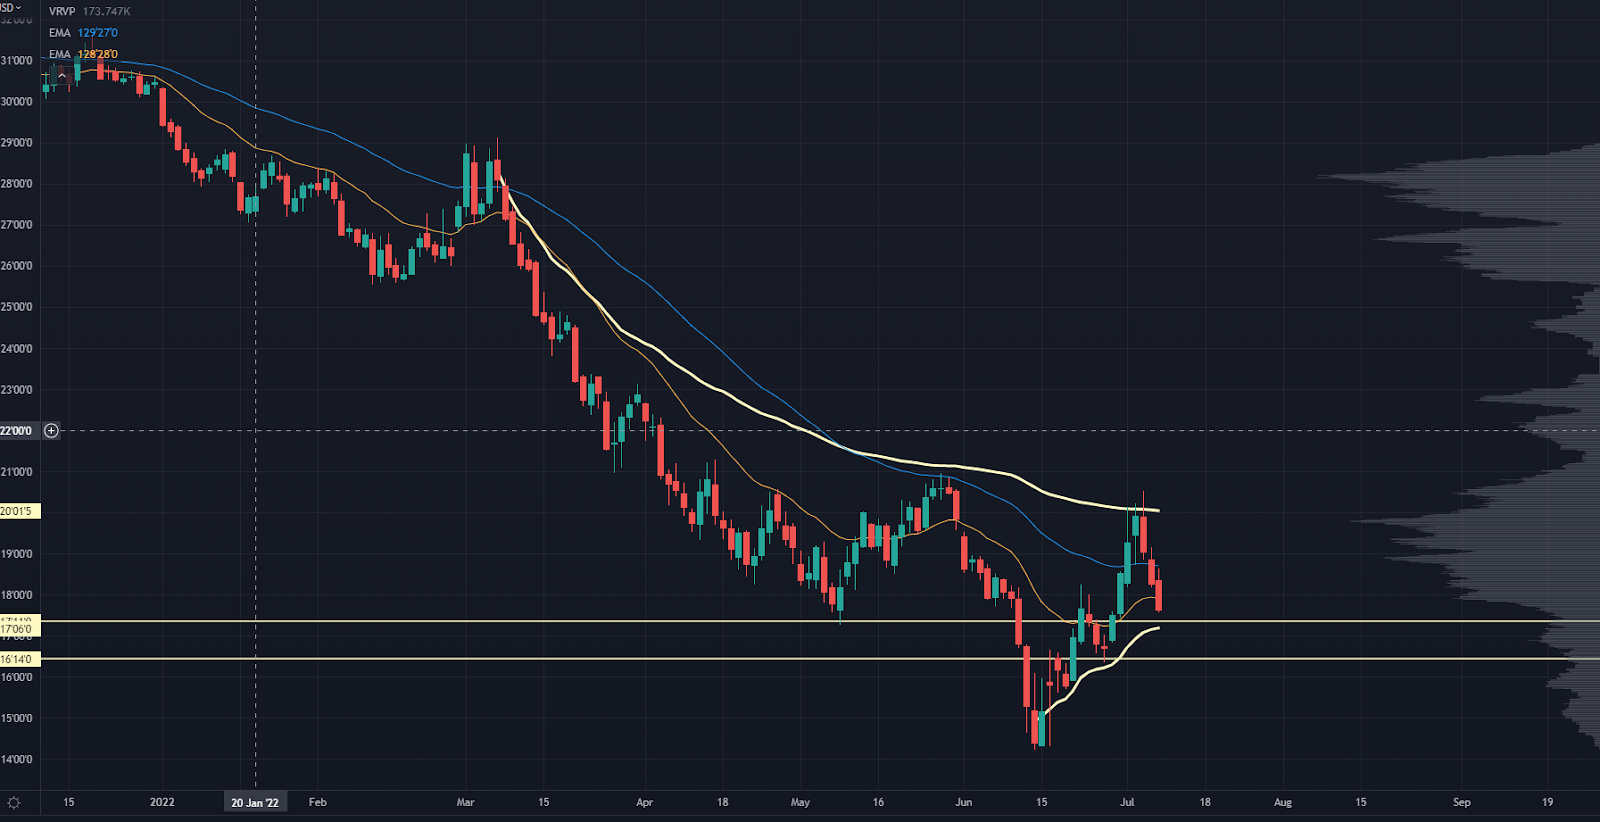
Take a look at the 10-year:
CPI Chart
The CPI crashed in mid-June, and that last push felt like a capitulatory move that flushed out the early dip buyers.
The market reverted where it was supposed to, and now we get to see how the market trades back into 116 -117 — a massive multi-year level.
The downtrend is still intact, but we aren’t seeing the same systemic cascade as we did through the first half of 2022.
What about equity risk?
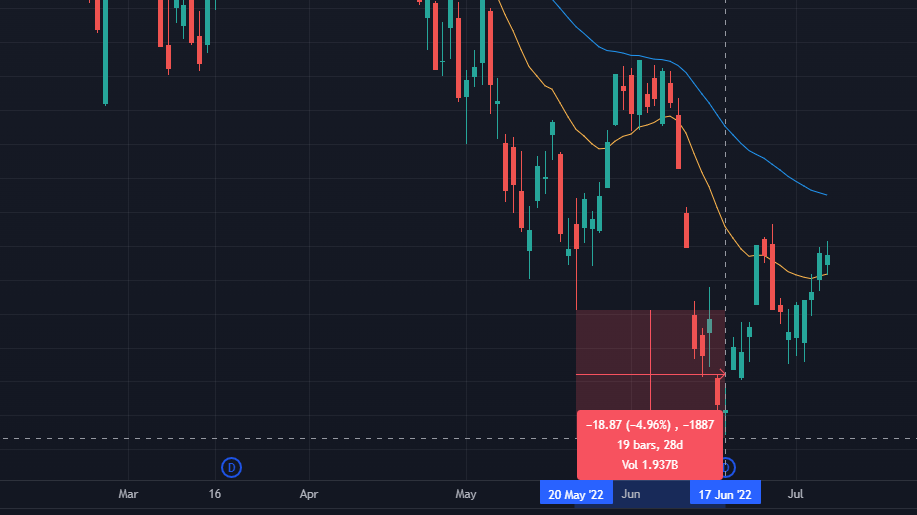
First, a quick measure of the distance on the lower low in the S&P 500:
S&P 500 Chart
Even if you nailed the bottom in May, the most recent push lower caused a 5% move against you.
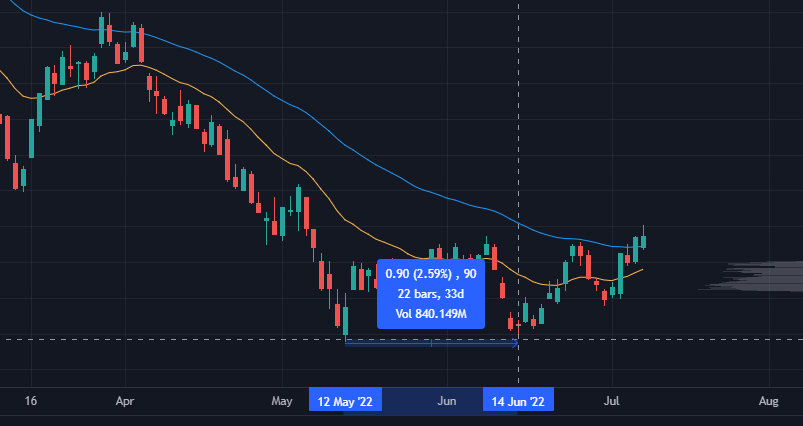
What about ARKK – the tech growth ETF?
ARKK Chart
Oh… that’s a *higher* low.
While broad markets and mega-caps were destroyed on macro risk, there was a break in correlation against the space down 70% from its 2021 highs.
You have to pay attention here — and maybe focus on individual names since they don’t have to follow the market on a 1:1 basis anymore.
SPY Chart
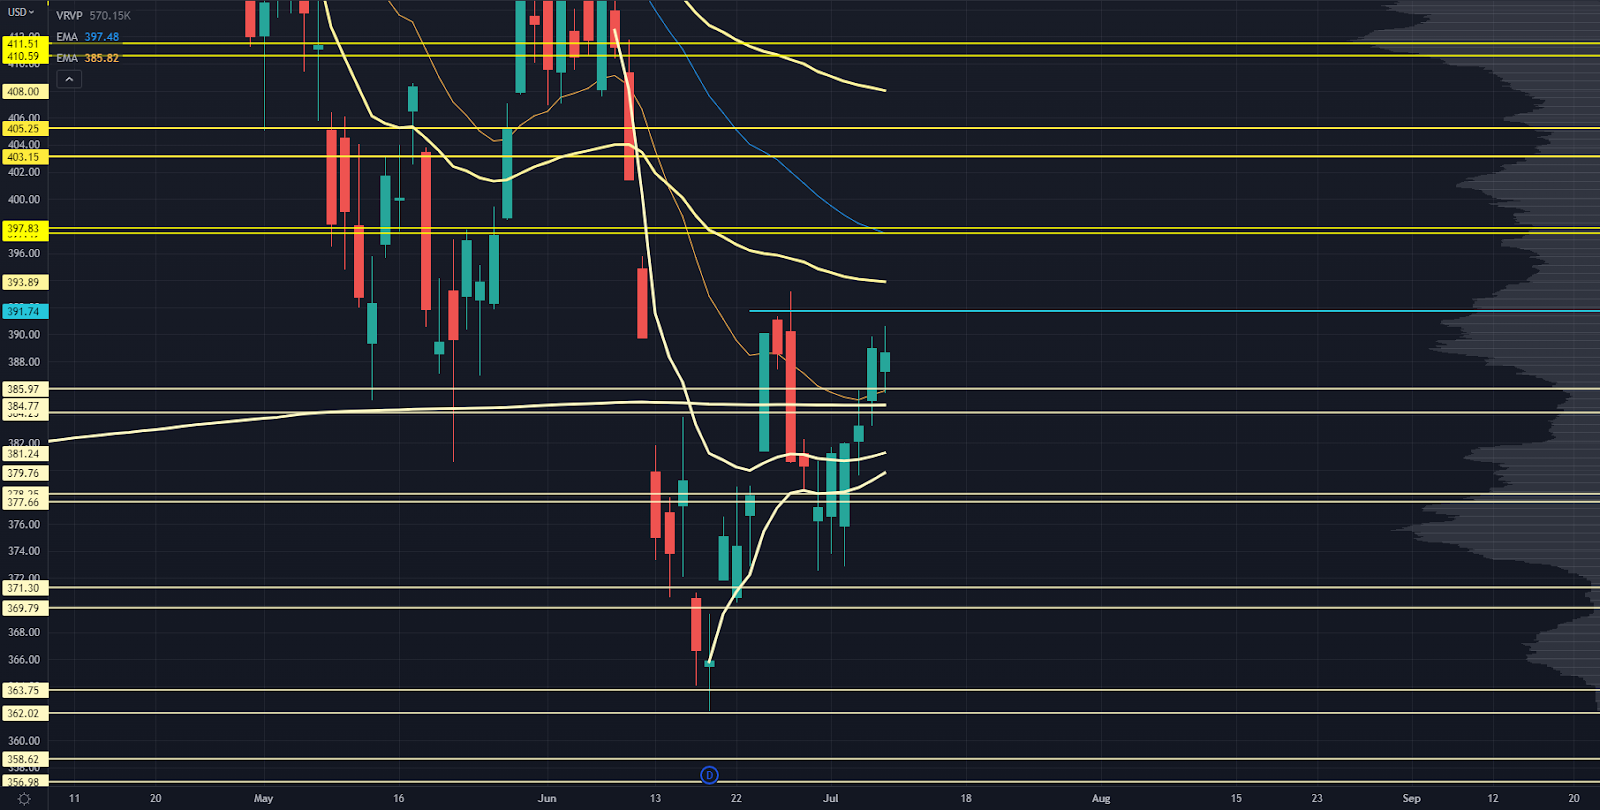
I’m viewing this as more of an “under-over” level.
It hasn’t seen too much response, but price has absolutely blown through it.
Consider it more of a liquidity pocket. If you want to be bullish early in the week, that would be a “nice-to-hold” level.
Not noted on the chart. We’ve got the swing Anchored Volume Weighted Average Price (AVWAP) from recent lows, the swing AVWAP from the June highs, and a small volume shelf developing.
This is also where the massive price response in May hit.
Not noted on the chart. Several aggressive price responses over the past two months have developed a volume shelf on a short-term basis.
Just underneath that is 371-369, which is very close to the upper level.
A dirty move in the market would be a test of the first level, a bounce, and then a divergence into the lower level to stop out the dip buyers.
Recent swing low. I don’t expect it to hold if it’s tested.
Next level on our Roadmap, which would be a good starting point to look for a bounce if we break the recent lows.
Late June found sellers there, and it’ll catch up with the swing AVWAP from the May highs.
Key low volume node (LVN), the 50 ema, and it’s close to a “half gap” fill from the CPI crash.
Not noted on the chart. Gap-fill close and high volume node (HVN).
I would consider this as more of a magnet, then start looking for a higher low to play.
This is a key LVN, and has seen prior price responses.
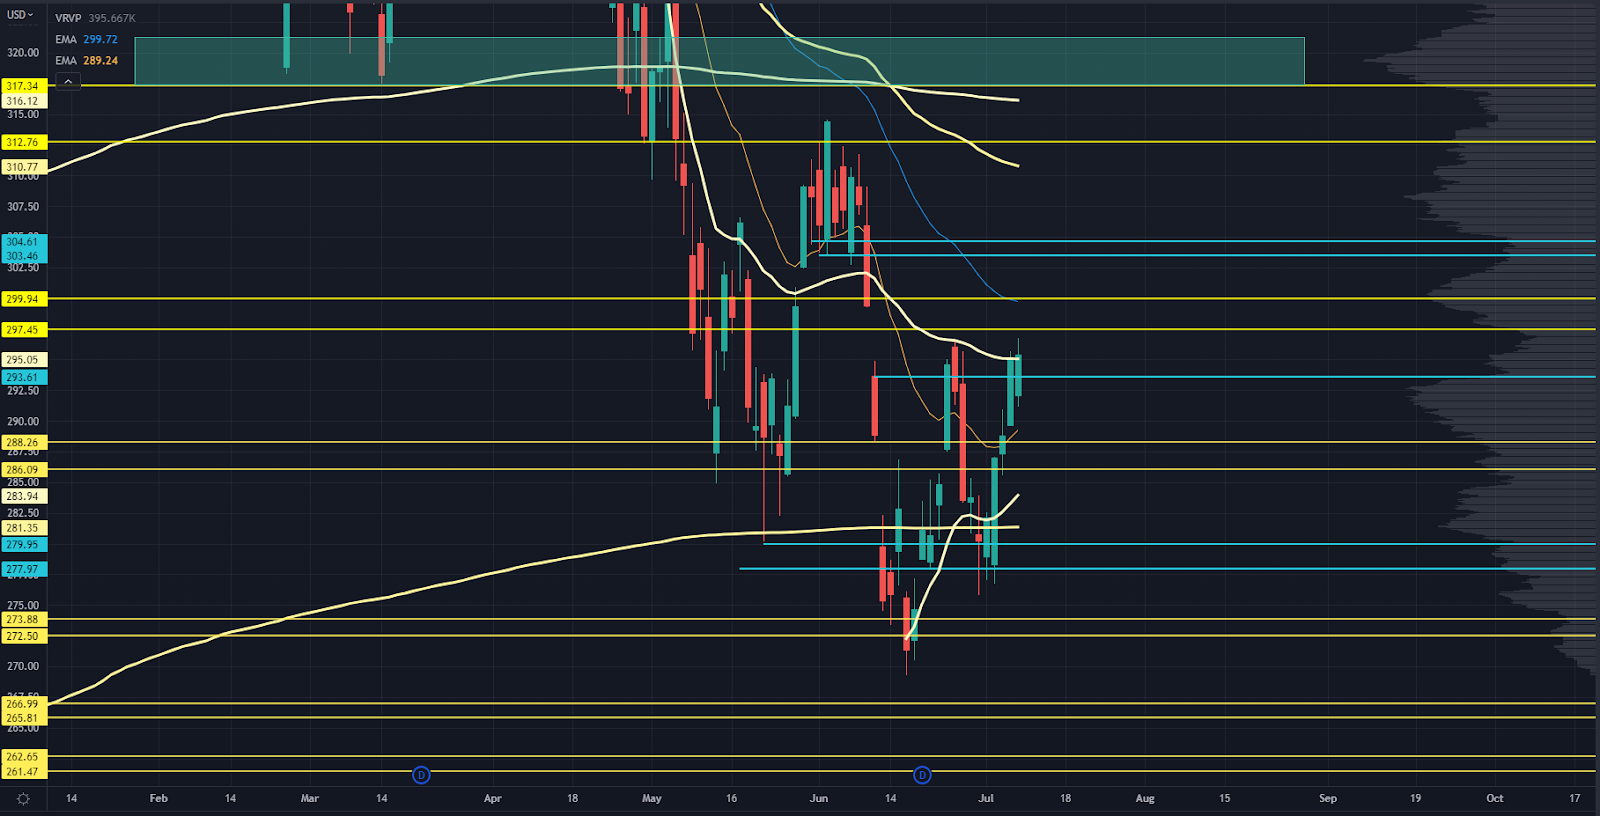
QQQ Chart
Key LVN, and will probably interact with the swing AVWAP against the recent lows.
A “must-hold” level on a structural basis. It’s where we had the May lows put in, and key buying responses at the beginning of July.
The lower low to start looking for a bottom if we break the most recent swing low.
Gap-fill with the declining 20DMA.
Upper end of a key LVN and where we saw price responses from 2020-2021. The more I look at this, the more it matters on a long-term timeframe.
June range support and the start of a volume shelf. This will line up with AVWAPs from March highs and March 2020 lows, respectively.
If we go quickly, this’ll be the upper end of the June range and the AVWAPs mentioned just above.
Just including this for reference. It’s the HVN that could act as a magnet on a longer-term basis.
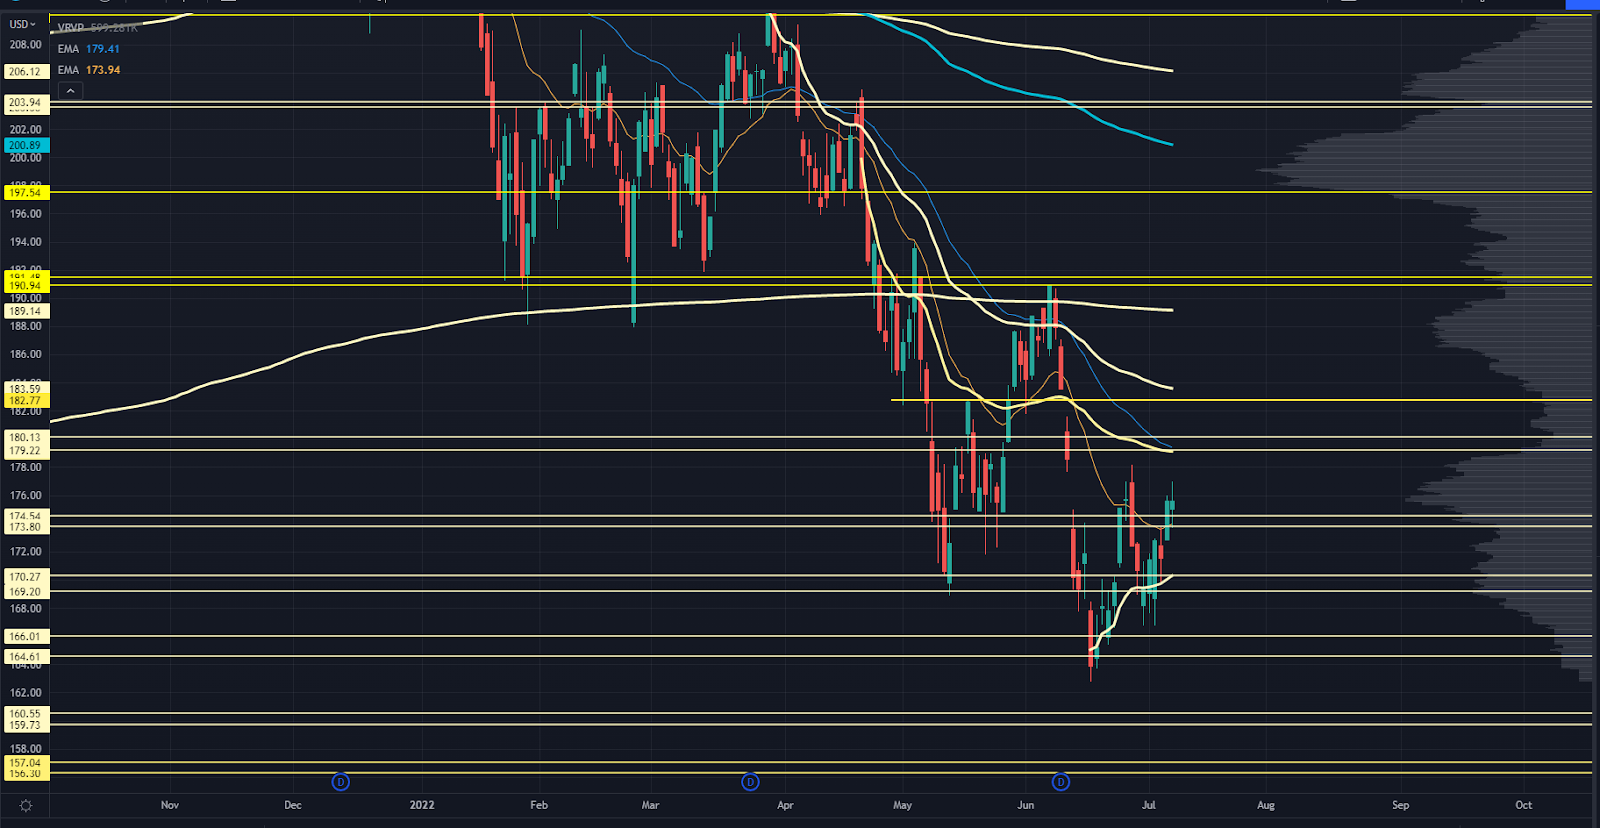
IWM Chart
My “over-under” level similar to SPY’s. A “nice-to-hold” for bulls at the start of the week.
Swing AVWAP from recent lows and key price interactions from May, and the “Gap” low from November 2020.
The gap fill from the November 2020 election. I feel this one has a better chance of “sticking” than the other indices if we retest. If we don’t, I’m targeting 160.
Gap-fill, 20 ema, and swing AVWAP from April highs.
Gap-fill and swing AVWAP from late March.
Note that the Russell seems to have the best shot at hitting this first, exhibiting the shift in relative strength to small-caps.
Absolutely massive long-term structural level.AVWAP from March 2020 lows, prior support from early 2022, and a huge LVN because not much trade is facilitated at those levels.
That’s it for this week’s Market Primer. For more information on the Market Roadmap I use to analyze these indices:
Check out this free training webinar.
Original Post Can be Found Here