So far, this market has been pretty “vanilla.”
A couple scary moves, constant liquidations into any pops, and then a grindhouse near the lows.
I can view this as a very hard landing after some aggressive spending post-pandemic, and the “tantrum” we’ve seen in equities was an unwind of this excess.
It’s painful, but sometimes it’s good to clear out the leverage in the system…
Unless we start to see an overcorrection.
I’ve previously warned how the Fed could overshoot because they’re looking at lagging indicators.
And while stock market volatility is bad…
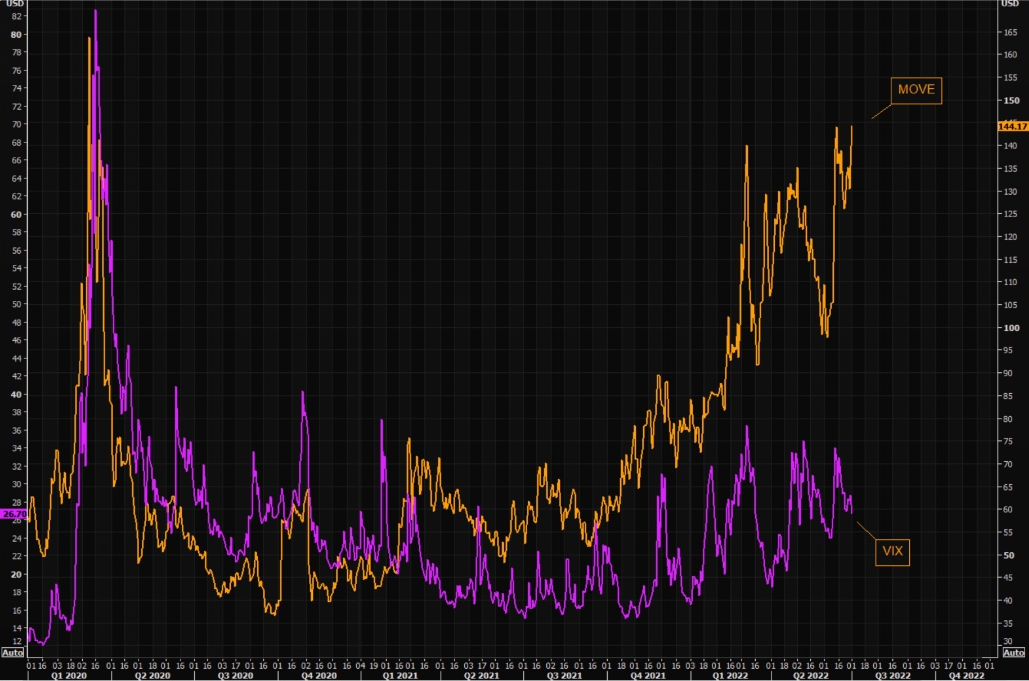
It’s nowhere close to what we’ve seen in the bond markets.
Here’s the MOVE index, which is kind of like the VIX for bonds. I included the VIX on the graph as well:

MOVE and VIX Chart
This is the real risk:
The bond market unwinds to a point where leveraged positions in “safe” bonds take enough stress to cause an unwind.
Remember Mortgage-Backed Securities (MBS)?
Safe bets that had too much leverage… and that forced a global financial crisis.
Now, I don’t think we’re seeing anything on that level…
But I’m constantly looking out for any stress in the system around the corner.
Let me tell you: things are looking a touch stressed right now.
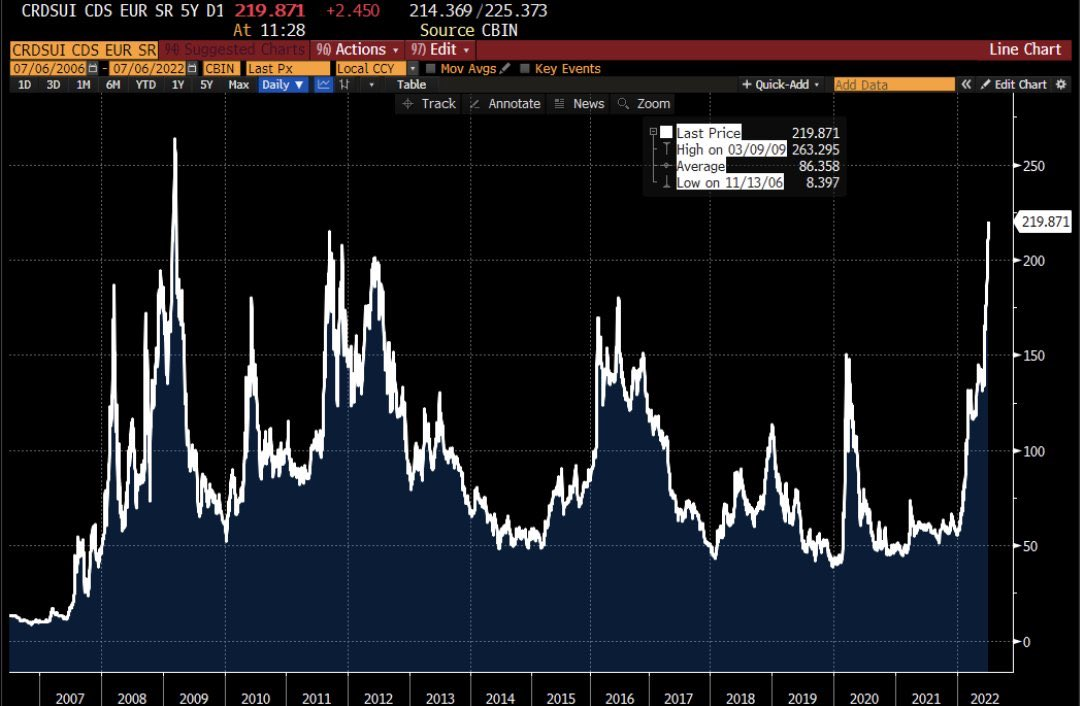
Here’s the Credit Default Swap (CDS) for Credit Suisse, a large European bank:

CDS Chart
To be clear:
This is the cost to insure against a major bank’s failure…
And it’s at levels not seen since the Great Financial Crisis.
If we keep going, this bear market could evolve into something much weirder than what we’ve seen
(Hard to even fathom, right?)
I don’t want to panic you, especially when I see some quality long setups in equities… but keep this on your radar.
So two things for your homework today:
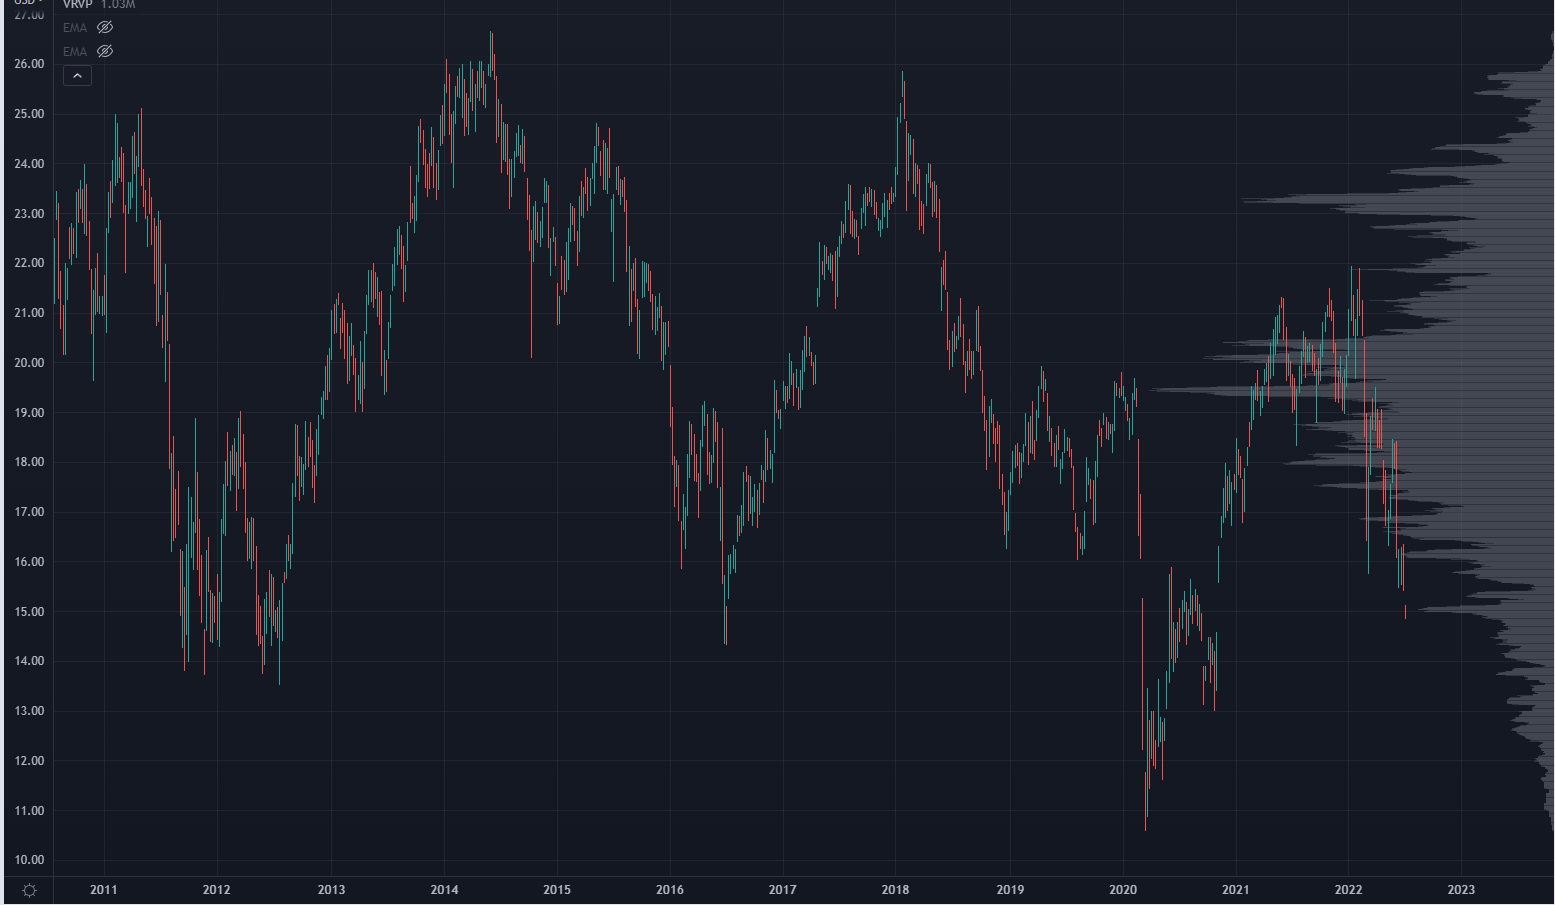
First, pull up a chart of EUFN. If European banks start going sideways, then you’ll get signs of it early here:

EUFN Chart
Second, if you need a way to aggressively trade this market, both long and short…
Attend this free training session to learn how I play the markets with my Trading Roadmap.
Original Post Can be Found Here