Early last week, plenty of pundits were calling for the next leg lower in the stock market.
And while that’s always a possibility, we had the odds lined up for a bounce– I’ll show you the mechanics of it, because I don’t think that the “macro” reason is completely understood.
First, let’s take a look at some weekly charts.
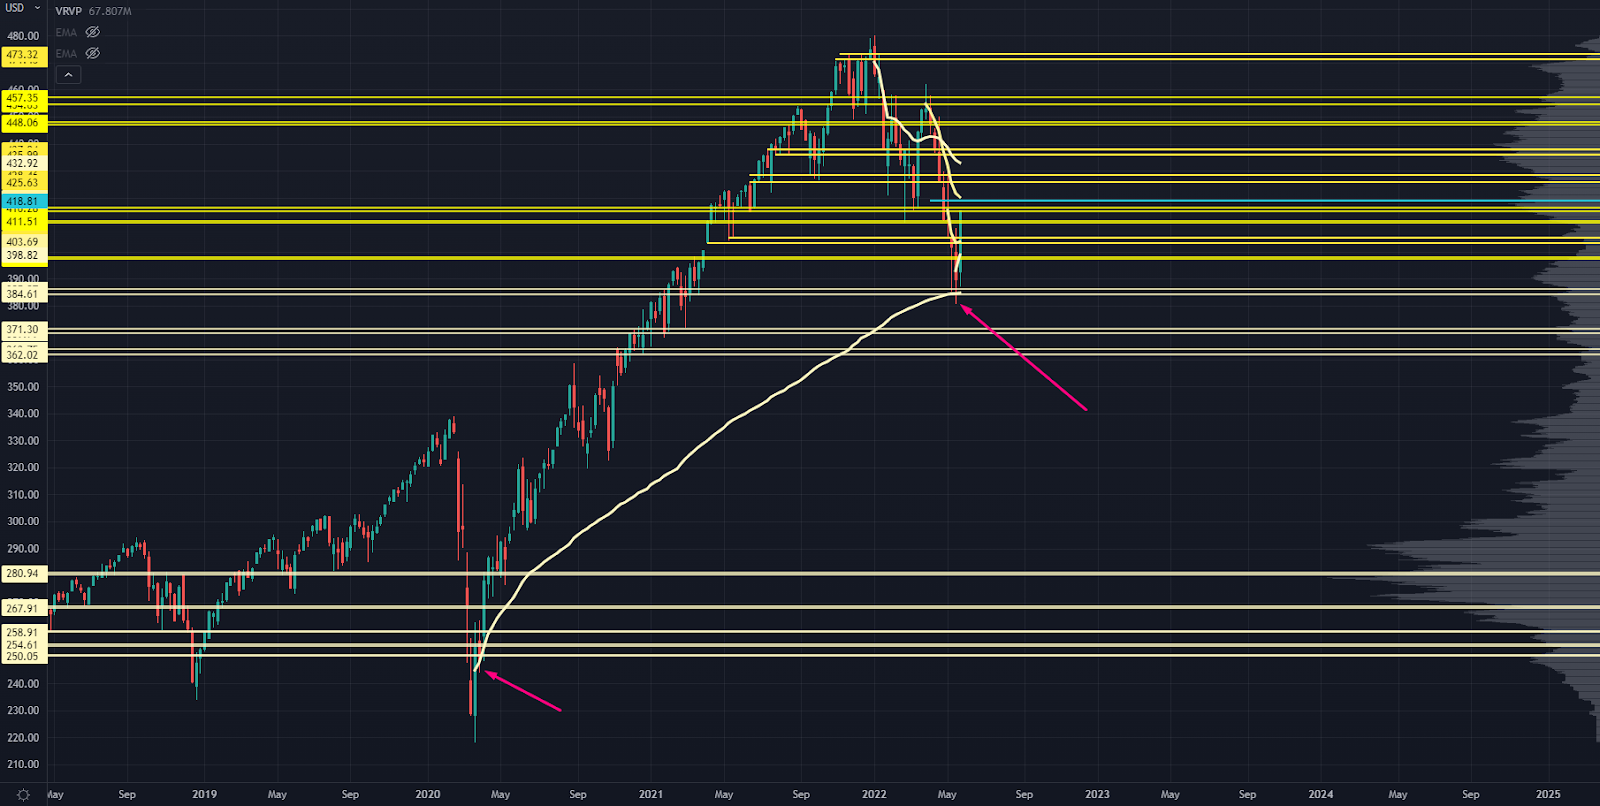
SPY Chart
It saw a key retest of the March 2020 Anchored Volume Weighted Average Price (AVWAP).
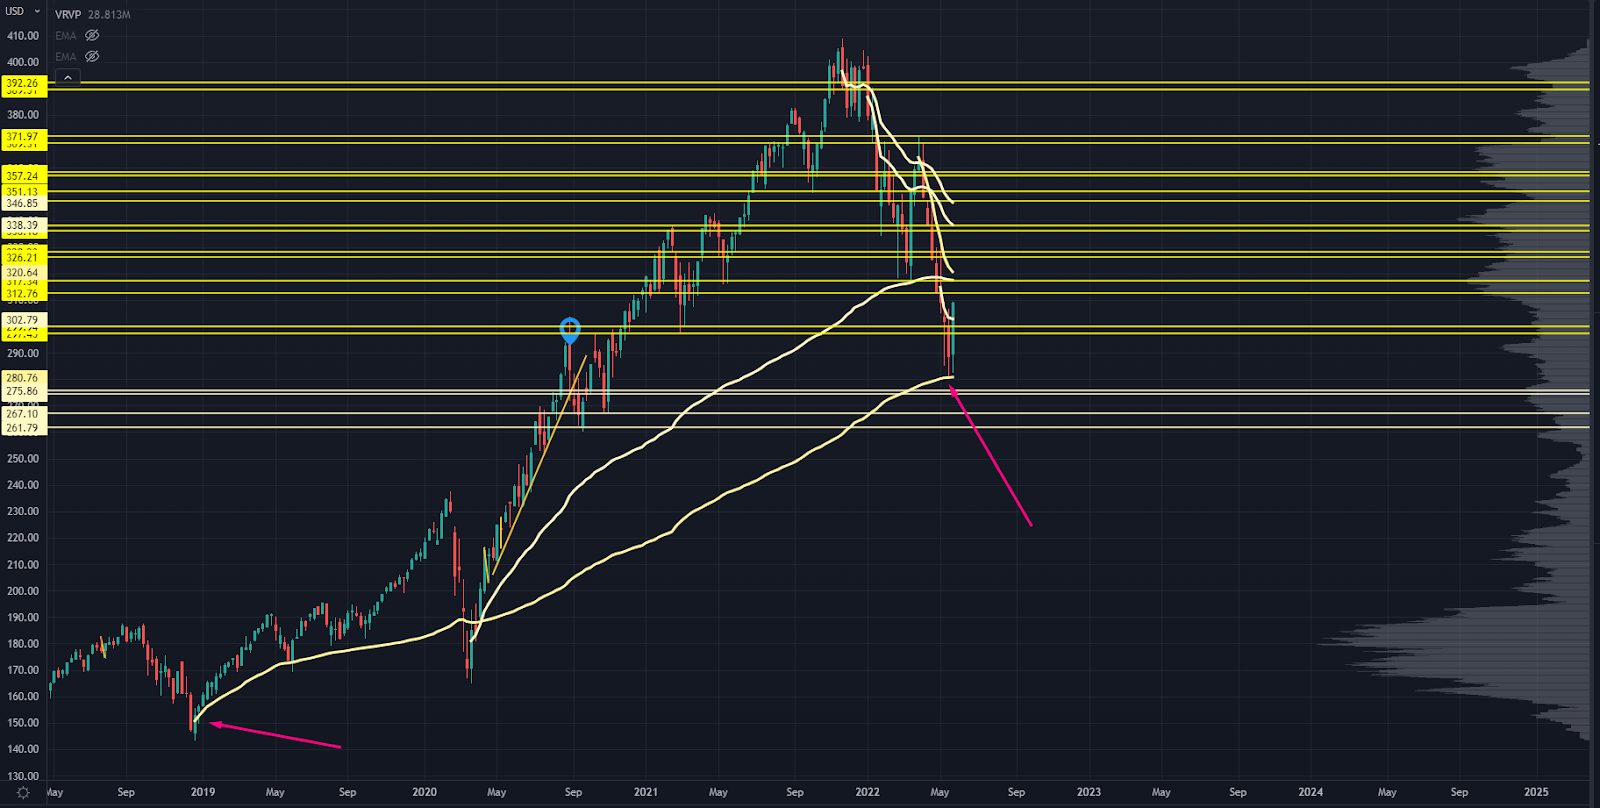
QQQ Chart
QQQ had a key retest of the December 2018 AVWAP.
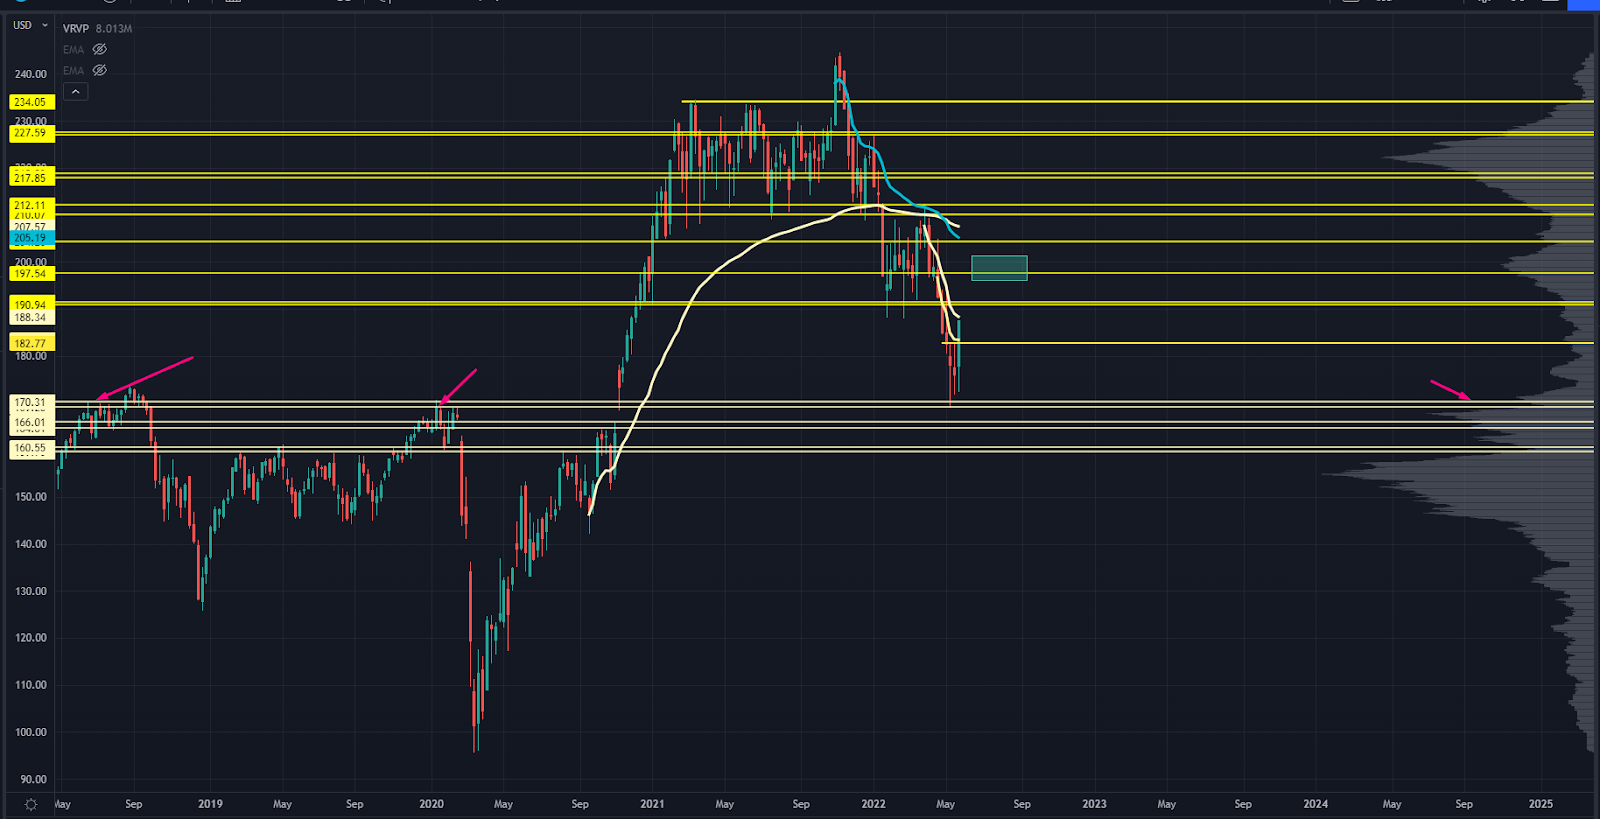
IWM Chart
Successful retest of first volume shelf and prior resistance from 2018 - 2020.
When the US markets are all hitting massive levels at the same time, you’ve got the recipe for a hard bounce.
Yet there were markets that started reverting before the stock market.
I’m talking about bonds, which we’ve been talking about this for months, like in this article.
Let’s look at some bond/Treasury charts.
Here’s a chart of ZN, the 10-year Treasury futures:
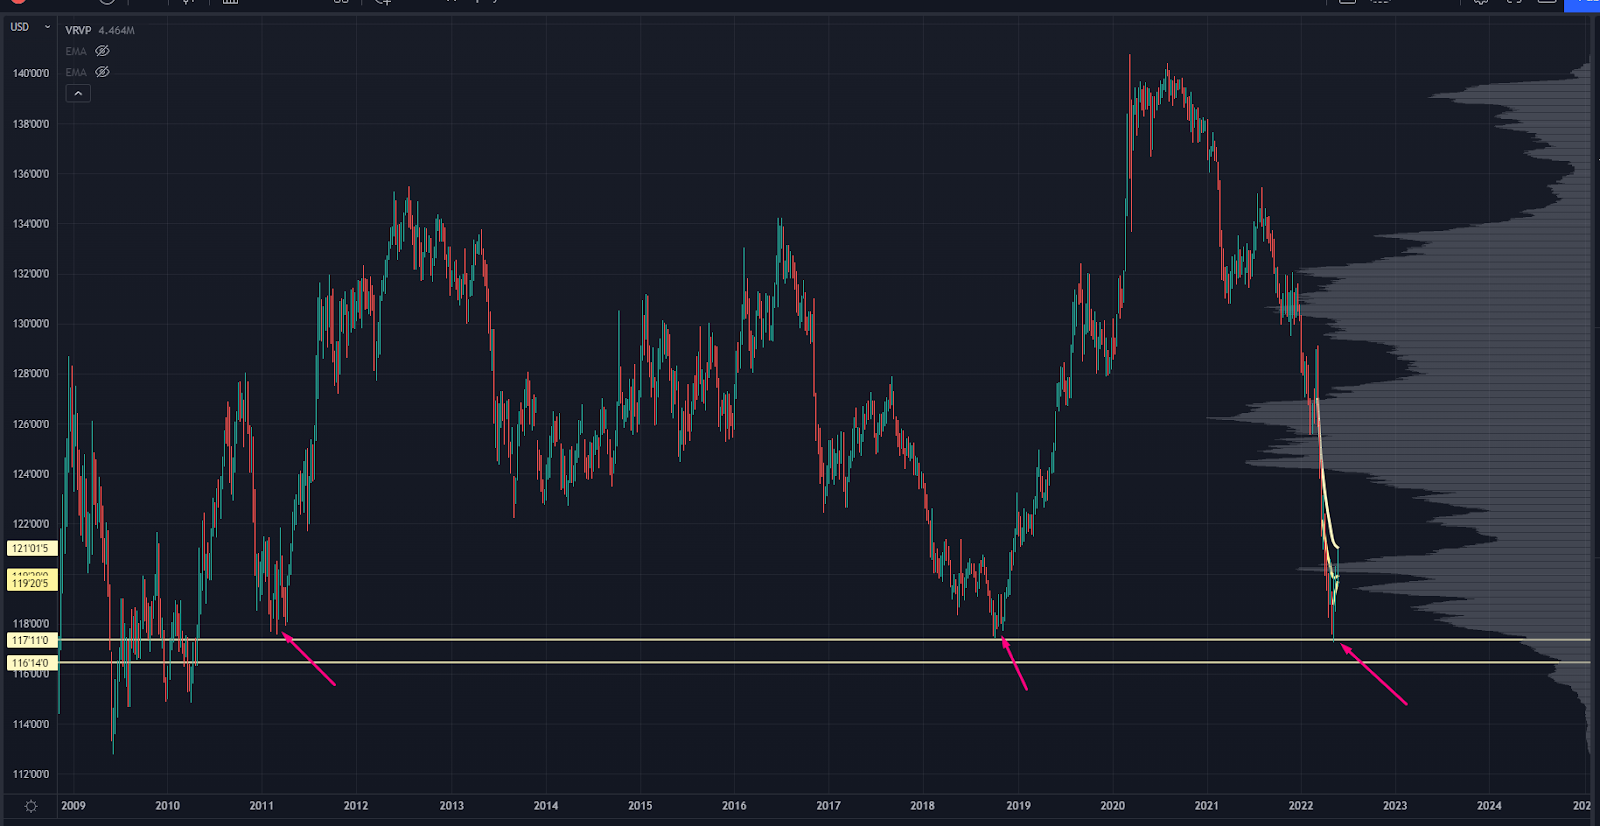
ZN Treasury Futures Chart
See how this level has been a place for bounces before?
You can look at different durations as well.
Here’s the ZT, the 2-year:
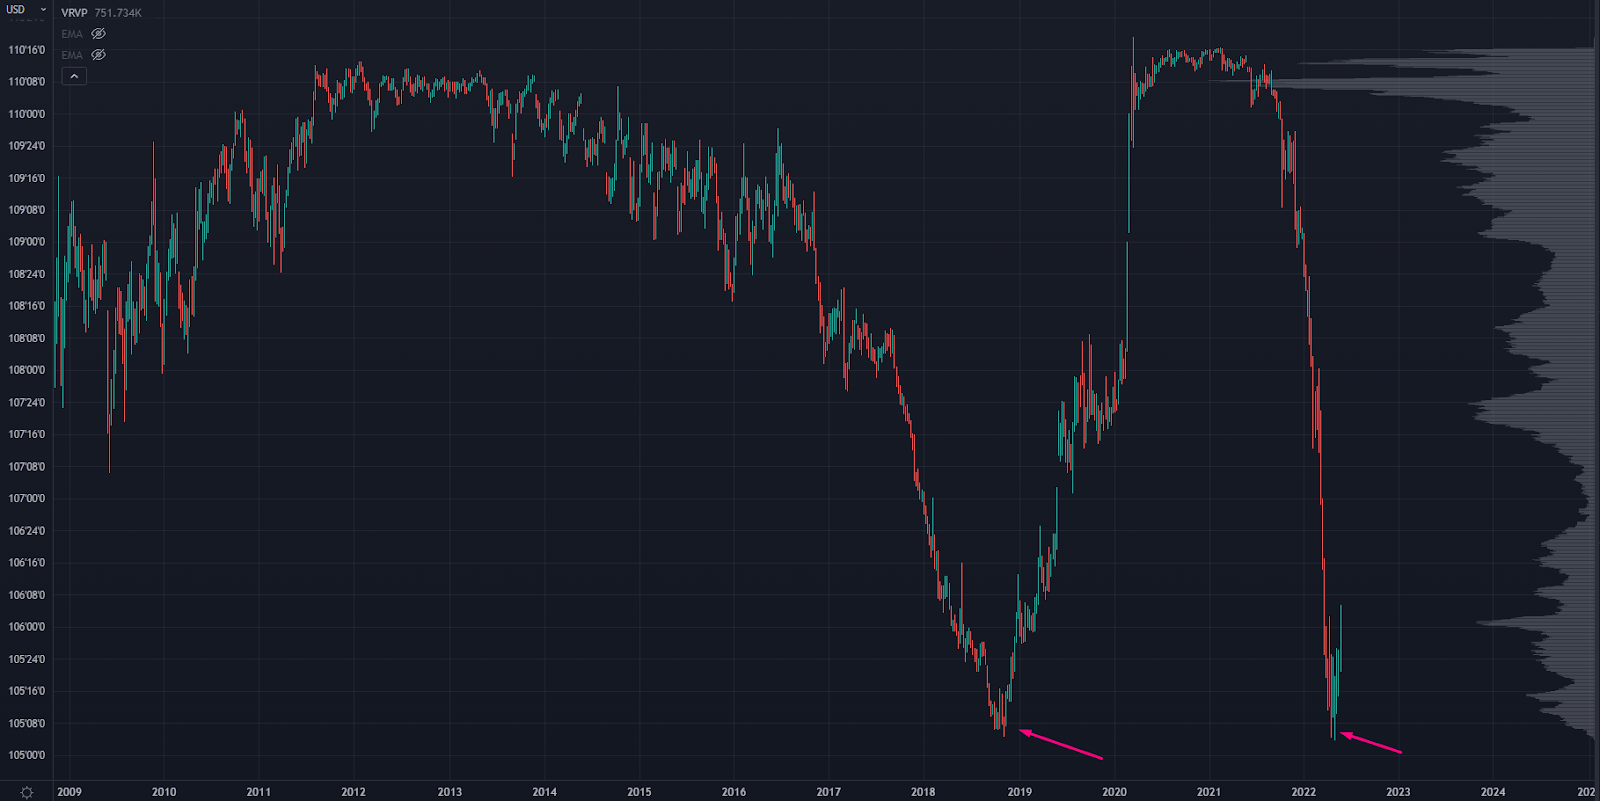
ZT Chart
And here is ZB, which is the 30-year bond:
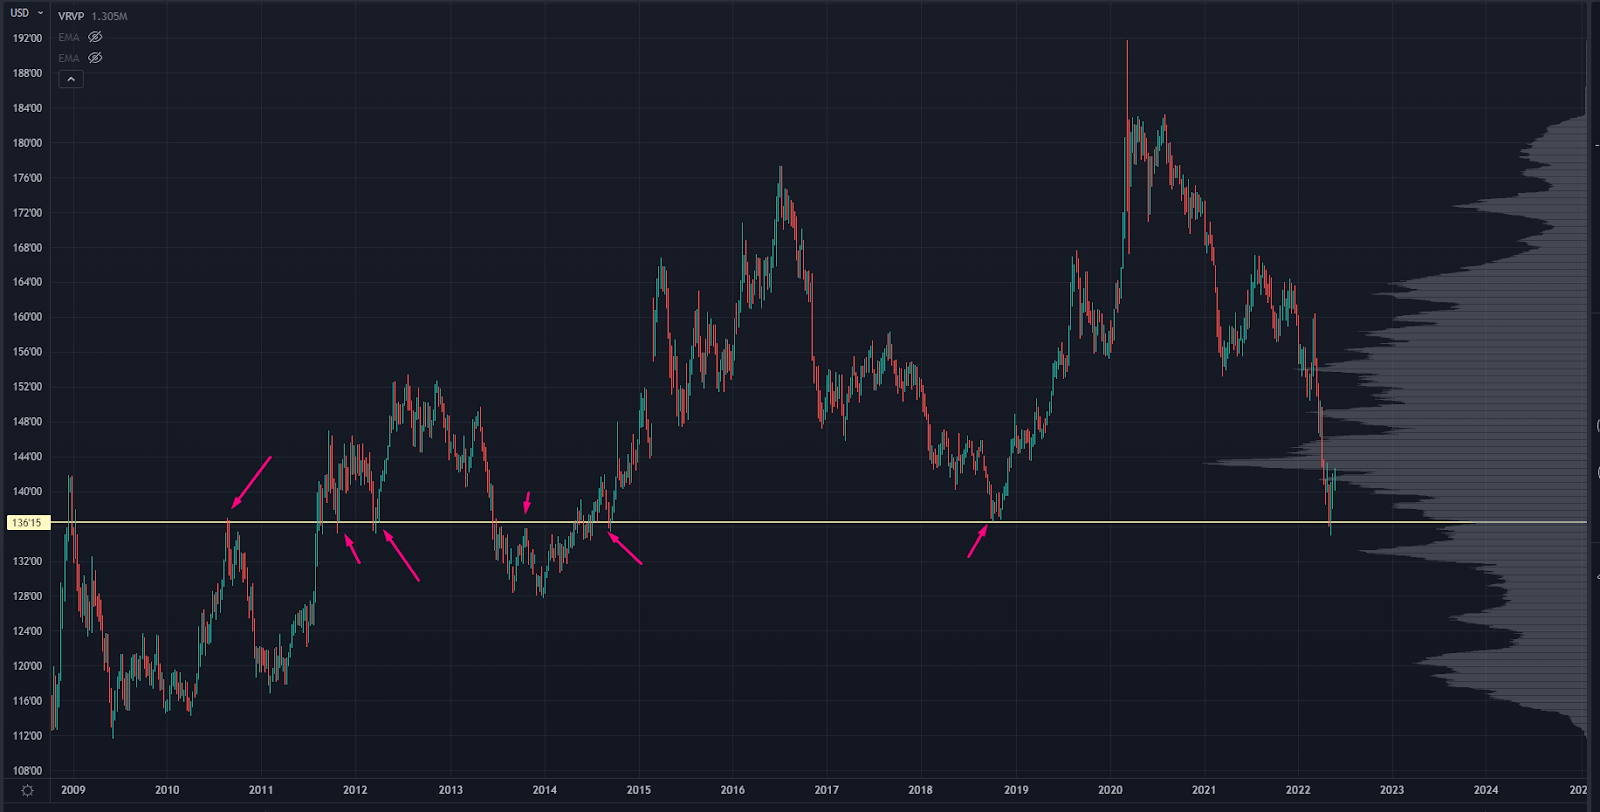
ZB Chart
So the Treasury market found buyers about two weeks before the stock market did.
This is a huge theme to follow for the rest of the year because risk markets are at the mercy of current Fed policy.
In a “normal” market, Treasurys and stocks tend to correlate negatively. When investors are scared, they’ll bail out of stocks and buy Treasurys for “security.”
But because of the Fed’s hard reversal at the beginning of the year, that relationship shifted.
When rates are moving so fast, it’s hard for institutions to adjust their models, much less stay liquid.
You also have the “leveraged risk parity” unwind that’s been happening throughout this year.
The bond bounce was the “relief valve” that allowed the stock market to avoid more forced selling and bring volatility down.
Until proven wrong, you should watch the bond market for clues about the markets overall.
Now, if you’re wondering how we found all these key levels, like VWAPs, AVWAPs, and volume shelves… these are part of our Market Roadmap.
As you might guess, this Roadmap finds key levels that help us see which way a stock (or anything else, really) could go next…
And plan our moves accordingly.
Head here for more information on our Roadmap.
Original Post Can be Found Here